Category: Guides

  • Secure Random String Generator for Tokens & Keys

    Secure Random String Generator for Tokens & Keys

    Needing secure strings for tokens, keys, or passwords and then hitting sign-up walls feels like wasted time. The simplest answer is to use a trusted, browser-based random string generator that runs fully on your device. Tools Repository’s Random String Generator does exactly that, with cryptographically secure randomness, no account, and no tracking at all.

    A random string generator builds unpredictable codes from letters, digits, and sometimes symbols, so you can create API keys, session IDs, promo codes, and test data in seconds. With Tools Repository you open the page, set length and character set, click once, and you’re done. Everything stays in the browser, which keeps sensitive values away from remote servers.

    This guide walks through what random strings are, who uses them, how to generate a random string online with Tools Repository, when to write code instead, and which mistakes to avoid. Ready for faster, safer strings without signup friction? Keep reading.

    Key Takeaways

    • A random string generator creates short or long codes from characters you choose. You use it for IDs, tokens, passwords, and placeholders. It replaces manual typing with quick, repeatable output.

    • Pseudo‑random strings use basic generators such as JavaScript Math.random. Cryptographically secure strings rely on sources such as the Web Crypto API. The second group resists guessing much better and suits secrets.

    • Common needs include session tokens, API keys, test data, and placeholder content for layouts. Random text also helps with coupon codes, raffle tickets, and reference numbers. One simple tool can support all these workflows.

    • Browser‑first generators that run entirely on the client keep secret values off third‑party servers. That design improves privacy for security strings and removes legal worries around storage of tokens.

    • Tools Repository delivers instant results with no login and no tracking. The Random String Generator uses a CSPRNG in the browser for strong output. It lives beside other free tools such as a Password Generator and SHA‑256 Hash Generator.

    Table of Contents

    What Is a Random String Generator and Why Do You Need One?

    Developer generating secure API keys on mechanical keyboard

    A random string generator is a small tool or function that builds unpredictable character sequences from a chosen alphabet. Each character comes from sets such as A–Z, a–z, digits, and optional symbols. The result behaves like a code you can paste into software, databases, or documents.

    In real work these strings stand in for IDs, tokens, temporary passwords, and many kinds of placeholders. Instead of inventing values by hand, you can create random string output that avoids patterns and repeats. That saves time and also reduces the chance that two users share the same identifier.

    Behind the scenes there are two broad classes of randomness:

    • Pseudo‑random generators (such as JavaScript Math.random) use formulas that appear random but follow internal state.

    • Cryptographically secure generators (often called CSPRNGs) use system entropy and strict rules so attackers cannot predict future values.

    According to OWASP, security tokens should always come from cryptographically strong sources, not from simple PRNGs.

    Entropy—how many different strings your setup can produce—matters a lot. With 62 possible characters and a length of 5, you already reach 62⁵, about 916 million possible values, as explained in guides for the entropy-string library. Longer strings grow that space fast, which sharply lowers collision odds — a principle explored in depth by recent work on Scalable Precise Computation of Shannon entropy in combinatorial settings. Tools Repository leans on this idea and lets you choose both length and alphabet to match your risk level.

    Who Uses Random String Generators? Real-World Use Cases

    Diverse team using online string generator tools for projects

    Random string generators support far more than back‑end code. Anyone who needs distinct looking text snippets can use them for daily tasks. Developers, designers, students, and small teams all depend on these little helpers.

    Here is how different groups typically use an online random string generator such as the one on Tools Repository.

    AudienceCommon Use Cases
    Web DevelopersSession tokens, API keys, CSRF tokens, unique database IDs
    UI and UX DesignersPlaceholder labels for mockups, component IDs in design systems, sample data for prototypes
    Students and ResearchersSample datasets, probability experiments, synthetic records for homework or demos
    Content WritersPromo codes, URL slugs, raffle ticket IDs, invoice references inside articles or campaigns
    Freelancers and Small Business OwnersDiscount codes, verification links, temporary login credentials for clients

    For web developers, a fast way to create random API key candidates, CSRF tokens, or one‑time links removes plenty of friction. According to MDN Web Docs, modern browsers expose secure crypto APIs, so these values can reach strong randomness even without server help. That gives front‑end engineers a simple path to better security.

    Designers and digital creators rely on realistic filler data rather than the same lorem ipsum line. Tools Repository can create random string batches that feel closer to real identifiers, which keeps high‑fidelity layouts clean. Students, content writers, and business owners also gain quick, repeatable codes without touching command lines or scripts. One simple, free string generator tool ends up in many bookmarks.

    How to Generate a Random String Online With Tools Repository

    Using browser-based random string generator tool online

    The easiest way to generate string output for keys, IDs, or test data is to use Tools Repository in your browser. This section shows every step so you can go from zero to copy‑ready string in seconds. No signup, no extension, no extra app.

    1. Open the Random String Generator Page

      Start with the Random String Generator page on Tools Repository. Any modern browser such as Chrome, Firefox, Edge, or Safari will work on desktop or mobile. You land on a clean screen with length and character set controls front and center.

    2. Choose Length and Character Set

      Next, pick how long the output should be.

      • Short values around 6–8 characters suit quick labels or slugs.

      • Longer values around 16–32 characters fit random token generator use cases or session IDs.

      You can keep it numeric, alphabetic, alphanumeric, or include extra symbols for more entropy.

    3. Generate and Copy Your String

      Then click the Generate button to create random string output in real time. The tool uses the Web Crypto API behind the scenes, which MDN Web Docs lists as a cryptographically strong random source on the web. The value appears instantly without a page reload. One more click copies it into your clipboard, ready for your editor, Postman collection, or database shell.

    4. Keep Your Strings Local and Private

      A key detail is privacy. Tools Repository runs this logic entirely on the client, so strings never leave your device. According to NIST, local generation removes a whole set of exposure risks from network paths. The platform also stays open source, free, and free from tracking. If you later need a random password generator, hash output, a random number, or a quick robots.txt, those tools sit in the same minimal interface.

    JavaScript vs. Online Tools: Which Should You Use to Generate Random Strings?

    Comparing JavaScript code versus online string generator tools

    Choosing between custom code and an online random string generator depends on how often and where you need strings. Developers may prefer in‑code functions, while many people just want a quick browser tool. This section breaks down those trade‑offs.

    When you expect to call string logic from inside an app, native code makes sense. For JavaScript in the browser, a simple loop over a character set with Math.random works for basic tests, placeholders, or slugs.

    “Math.random() does not provide cryptographically secure random numbers.”
    — MDN Web Docs

    Because of that, Math.random should not back tokens or passwords.

    For security work you should use the Web Crypto API in the browser or the crypto module in Node.js. These APIs hook into the operating system entropy pool and pass strict checks from standards groups such as NIST. Python users reach for the secrets module to generate strong string values on the server side. In each case the idea stays the same, but the call style fits the language.

    If you just need to create random string batches by hand, code adds overhead. Here is a simple rule of thumb that also covers people who do not code:

    ScenarioRecommended Approach
    One‑off string with no scriptOnline tool such as Tools Repository
    JavaScript generate random string for test dataMath.random with a clear character set loop
    Generate random API key or token in productionWeb Crypto API, Node.js crypto, or Python secrets module
    Huge batch or automationLanguage‑specific loop or an entropy‑aware library such as entropy-string

    Tools Repository sits in that first row. It works well when you want fast, safe strings by hand or during quick testing, without opening an IDE or touching GitHub.

    Common Mistakes to Avoid When Generating Random Strings

    Security padlock symbolizing common random string generation mistakes

    Random string tools feel simple, yet a few choices can weaken security or break uniqueness promises. Knowing these mistakes helps you pick better defaults, even when you just click a button in the browser. Here are pitfalls worth avoiding.

    • Using Math.random for secrets
      Many people use Math.random for secrets such as password reset links or API keys. This function is fine for mock data, but it does not give strong protection against prediction. For any secret value, pick a generator that clearly states cryptographic strength, such as Web Crypto in the browser or Node.js crypto.

    • Picking strings that are too short
      Short strings often seem safe because they look random to the eye. The math tells a different story, since collision chances rise fast with volume — a challenge explored in A Review of Methods for string complexity, which quantifies how quickly short sequences become predictable under volume. With a 62‑character alphabet and length of 5, you expect repeats after around 30 thousand strings, as explained by guides on entropy-string. Production IDs should start around 10 or more characters instead.

    • Including confusing characters in human‑typed codes
      Codes that people type by hand can turn messy when they mix similar symbols. Characters such as zero, uppercase O, lowercase l, and digit one confuse users and support staff. For promo codes or activation keys, filter those out so people can read and share values without mistakes.

    • Using server‑side tools that log generated strings
      Some online tools send data to remote servers and possibly log everything — a privacy risk underscored by research on Generating borderline test samples for randomness testers, which highlights how outputs from weak or logged generators can be reverse-engineered. That design conflicts with secret uses such as token creation. A client‑side generator such as the one on Tools Repository keeps all values local, so sensitive strings never cross the network during creation.

    Tip: When you’re unsure which settings to pick, choose a longer string and a wider character set from a cryptographic generator. That simple habit goes a long way toward keeping tokens hard to guess. — Tools Repository Team

    Wrapping Up

    Random strings sit under a surprising amount of digital work, from API keys and CSRF tokens to promo codes and invoice numbers. A good random string generator saves time, improves uniqueness, and raises security when you pick a strong source. Longer values and wider alphabets give better protection.

    For many tasks a free online random string generator is the fastest choice. Tools Repository focuses on that space with a client‑side, CSPRNG‑based tool that needs no account and no setup. When you later need heavy automation, you can switch to Web Crypto, Node.js crypto, or Python secrets. For now, open Tools Repository, set your options, and create safe strings in a couple of clicks.

    Frequently Asked Questions

    Question: What is the safest way to generate a random string for an API key or token?

    The safest approach uses a cryptographically secure generator such as the Web Crypto API in the browser or Node.js crypto.randomBytes. These sources draw from strong entropy, which limits prediction. Tools Repository’s Random String Generator also relies on a CSPRNG and runs fully in the browser, so sensitive strings never reach a remote server.

    Question: How long should a random string be to avoid duplicates?

    Longer strings with rich alphabets cut collision risk far more than short ones. With a 62‑character set, 5 characters give under a billion possible values, so repeats appear quickly, as entropy‑string examples show (entropy-string). For production IDs, aim for at least 10 characters and use entropy‑aware libraries for very large datasets.

    Question: Can I generate a random alphanumeric string without writing code?

    Yes, you can generate a random alphanumeric string in the browser with no code at all. Tools Repository’s online random string generator lets you pick length and character set, then create output with a single click. It runs instantly, needs no installation, and suits both technical and non‑technical users.

    Question: Is it safe to use an online random string generator for passwords?

    It can be safe when the tool runs client‑side and uses cryptographically secure randomness. Tools that send data to servers may log output, which is risky for passwords. Tools Repository keeps all password and string generation inside the browser and also offers a dedicated Password Generator built on the same privacy model.

    Question: What characters should I include in a random string for maximum security?

    For strong security include uppercase letters, lowercase letters, digits, and a set of special symbols. This wide alphabet increases entropy for each character position. When people must type the code by hand, you can remove confusing symbols such as zero and uppercase O. A longer random string with a broad set gives far better resistance against guessing.


  • Km to Steps Calculator: Convert Distance to Steps

    Km to Steps Calculator: Convert Distance to Steps

    Table of Contents

    Introduction

    Turning a distance in kilometers into a clear step count often feels like guesswork across apps. Different trackers use different assumptions, so totals rarely match. For a fast, free km to steps calculator, Tools Repository’s browser-based Steps to Km Converter gives accurate, private results instantly in your window.

    This tool turns any distance into a personalized step estimate using stride formulas from exercise science instead of one fixed number. It helps answer questions such as:

    • How many steps are in a kilometer?

    • What does 10,000 steps really mean in distance?

    • How do your own height and pace change the totals?

    You can also flip step counts back into kilometers when your watch only shows steps.

    Keep reading for quick reference tables, simple rules of thumb, and a no sign-up converter that runs completely on your device.

    Key Takeaways

    Before looking at formulas and tables, it helps to anchor a few simple ideas. These points keep every later calculation in perspective.

    • Conversion between kilometers and steps is personal. Pace changes the count a lot, and height and biological sex shift stride length.

    • Average walking speed gives about 1,408 steps per kilometer. That figure comes from lab-based research. Your own result will sit somewhere around it.

    • 10,000 steps usually equals six to eight kilometers. Faster movement stretches each step out; slower walking shrinks the distance.

    • Tools Repository offers a steps and distance converter that works in real time. It updates as you type, with no login, tracking, or server storage.

    • Both km to steps and steps to km views matter. One helps when you plan routes by distance; the other helps when devices only store step totals.

    “What gets measured gets managed.” — Peter Drucker

    If you can turn distance into steps (and back again) quickly, it becomes much easier to track real progress instead of just guessing.

    What Is a Km to Steps Calculator and How Does It Work?

    Person walking briskly on sunlit park path

    A km to steps calculator is an online tool that turns any distance in kilometers into an estimated number of steps. The stronger versions, such as Tools Repository’s Steps to Km Converter, use details like height, biological sex, and pace to shape that estimate. This gives a much closer picture than a single average number for everyone.

    Most people meet step counts through a smartwatch or pedometer from brands such as Fitbit, Apple Watch, or Garmin. Those devices record each step directly but may not show distance very clearly. On the other side, apps like Strava, MapMyRun, or Google Maps talk in kilometers or miles, not steps. A solid calculator connects these views so activity data lines up.

    Research from the Centers for Disease Control and Prevention notes that adults should aim for at least 150 minutes of moderate activity each week. Many people track that time through steps, so having a reliable distance-to-steps converter helps them judge progress. Instead of wondering whether a 3 km walk meets part of that target, a calculator shows roughly how many steps it represents for their body.

    A good km to steps calculator usually asks for a few core inputs after you type the distance:

    • Biological sex affects average stride length. On average, men of the same height take slightly longer strides than women, so they record fewer steps per kilometer.

    • Height is strongly linked with leg length. Taller people often need fewer steps to cover a kilometer, while shorter people take more, even at the same speed.

    • Pace or speed changes how far each step travels. A slow stroll creates many small steps, while a fast run stretches each stride, cutting the step count.

    • Some tools also accept body weight when you want calorie estimates based on distance, speed, and time.

    Tools Repository processes these details in its Steps to Km Converter right in the browser using JavaScript. All math stays client-side, so no physical measurements, step counts, or identifiers ever leave the page. That local processing lines up well with the privacy goals many users now share.

    Tip: When you first use a calculator, match the output with a known walk or run from your smartwatch. If the numbers look close, you can trust it for quick planning later on.

    How Many Steps Are in a Km? The Science of Stride Length

    Measuring tape and running shoes for stride length

    The number of steps in a single kilometer usually falls between about 875 and 1,408, depending mainly on stride length and speed. Put simply, slower walkers take more, shorter steps, while faster runners take fewer, longer steps. So the answer is a range, not a single fixed value.

    According to data summarized in ACSM’s Health & Fitness Journal, adults walking at around 5 kph take roughly 1,408 steps per kilometer on average, a figure supported by research on Frontiers | Step cadence and its relationship to physical activity intensity. The same research from the American College of Sports Medicine shows that running at about 12 kph drops this to roughly 875 steps. Those results came from controlled treadmill testing on adults of normal weight.

    Stride length sits at the center of this pattern. In measurement work, a “step” is usually treated as half a full stride. A common engineering baseline is a 0.762 meter step length, which is about 2.5 feet. Using that constant, one kilometer becomes about 1,312 steps. The International System of Units treats that as a handy fixed standard, but real people rarely walk exactly like that.

    Several factors pull your own stride away from the textbook value:

    • Height shapes natural step size. Someone who is 6’3″ will almost always cover more ground per step than a person who is 5’1″, even on the same flat street in New York City.

    • Biological sex affects limb proportions and gait. Men often record slightly longer strides than women of equal height, which shows up as fewer steps per kilometer at shared speeds.

    • Pace changes joint angles and contact time. As your speed rises from gentle walk to brisk walk to jog, each step tends to stretch out, so the step count per kilometer falls.

    • Weight and fitness level play quieter roles. Heavier individuals or people returning from injury sometimes use shorter, cautious steps, which pushes the count upward a bit.

    The World Health Organization highlights regular walking and running as practical ways to reach weekly activity targets. Knowing that around 1,400 steps per kilometer is a solid walking average, and that running usually sits between 900 and 1,100 steps, helps place those activities in a concrete frame. Tools Repository uses numbers from sources like ACSM and the Compendium of Physical Activities to keep its stride formulas grounded in published research, consistent with findings on the accuracy and reliability of accelerometer-based pedometers across walking, running, and stair-climbing activities.

    If you want to estimate your stride length without a device:

    1. Measure a straight 20-meter or 50-foot path.

    2. Walk it at your normal pace, counting every step.

    3. Divide the total distance by your step count to get average step length.

    4. Use that number in a km to steps calculator for a closer personal match.

    Km to Steps Conversion Reference Table

    This km to steps conversion reference table shows how research-based averages play out across common distances and paces. The step counts blend male and female results from the ACSM-linked study into single midpoints.

    Distance kmAverage Walk 5 kphBrisk Walk 6.5 kphRun 9.5 kphFast Run 12 kph
    11,4081,2091,045875
    22,8162,4182,0901,750
    34,2243,6273,1352,625
    57,0406,0455,2254,375
    1014,08012,09010,4508,750
    1521,12018,13515,67513,125
    2028,16024,18020,90017,500
    2535,20030,22526,12521,875

    For a fixed stride baseline using 0.762 meters, one kilometer equals about 1,312 steps, so ten kilometers equals about 13,123 steps. Your own results from a km to steps calculator will fall near these values but rarely match them exactly.

    How Far Is 10,000 Steps in Km? Reverse Conversions Explained

    Jogger with smartwatch tracking steps and distance

    Ten thousand daily steps usually work out to roughly six to eight kilometers, depending on how quickly someone moves. Once again, stride length and pace explain most of the variation. Slower walkers cover less ground per step, while brisk walkers and runners cover more.

    Using the ACSM averages:

    • 10,000 steps at a relaxed walking speed of 5 kph map to about 7.1 kilometers.

    • At a brisk 6.5 kph walk, the same 10,000 steps equal about 8.3 kilometers.

    • At a running pace of 9.5 kph, those steps spread over about 9.6 kilometers.

    These figures match the rough “six to eight kilometers” rule many coaches use when they speak about that classic step goal.

    Here is a smaller reverse conversion table to show how steps translate into distance for different walking or running styles.

    StepsAverage Walk 5 kphBrisk Walk 6.5 kphRun 9.5 kph
    1,0000.7 km0.8 km1.0 km
    5,0003.6 km4.1 km4.8 km
    10,0007.1 km8.3 km9.6 km

    You can see why people who jog with Strava or Nike Run Club sometimes record fewer steps than friends who walk with a Fitbit or Samsung Health app, a discrepancy examined in studies on associations of daily step count with health outcomes in large adult populations. A runner at 12 kph might finish a 10 km route with about 8,750 steps, while a slower walker at 5 kph needs about 14,080 steps over the same path. Yet the runner likely spends less time and gains stronger cardiovascular stress during that session.

    Research shared by Harvard Health Publishing notes that health gains start well below 10,000 steps and rise steadily as daily movement increases, a pattern also documented in the Effects of the ‘10,000 Steps Duesseldorf’ community intervention promoting physical activity in adults. The key message is that step count is just one yardstick. Distance, pace, hills, and even surface all matter for heart and lung benefits.

    For planning, 10,000 steps as six to eight kilometers works nicely. Commuters in cities like Chicago or San Francisco can check how much of that target they already cover during daily walks to transit. A distance to steps converter, such as the one from Tools Repository, then helps turn a known route length from Google Maps into either a total step goal or a check against what a watch shows.

    Tip: If your watch reports both distance and steps, compare them a few times. If the numbers stay close to these tables, you can use 10,000 steps as a comfortable benchmark for your day.

    Use the Tools Repository Steps to Km Converter for Instant Results

    Smartphone with fitness step tracking app on desk

    Tools Repository’s Steps to Km Converter gives instant km to steps and steps to km results right in the browser. It acts like a specialized km to steps calculator that understands personal stride patterns instead of forcing everyone into one simple average. You enter your details once and get live updates as you adjust distances or step counts.

    On the page, the tool asks for core fields that match what researchers use. You can:

    • Select biological sex

    • Enter height in centimeters or feet and inches

    • Choose a pace category from very slow walk up to very fast run

    • Type either a distance or a step count

    The calculator then shows the matching value in kilometers and miles below. It feels similar to using a pedometer readout, only with more context.

    Behind the scenes, Tools Repository bases the math on formulas also used in medical fields such as BMI and BMR work. Values from the Compendium of Physical Activities inform its pace choices, which keeps estimates in line with studies used by sports scientists and physiotherapists.

    Several small design choices make the tool practical for everyday use:

    • Everything runs client-side in JavaScript, with no requests sent to a server. This keeps height, weight, and step counts completely on your device, which privacy-focused users and developers often prefer.

    • The layout is responsive and clean, so it works well on Android phones, iPhones, tablets, and desktop machines. Web creators who spend their days in Figma, Canva, or VS Code will find that it behaves like a simple web app, not a cluttered landing page.

    • The Steps to Km Converter sits beside other tools such as the Length Converter, Weight Converter, Interval Timer, and BSA Calculator. That makes it easy to handle unit tweaks, workout timing, and body metrics in the same browser tab.

    According to Pew Research Center, about one in five adults in the United States regularly uses a smartwatch or fitness tracker. Those users often juggle data between tools such as Tools Repository, Apple Health, Google Fit, and training platforms like TrainingPeaks. Tools Repository offers a quiet middle layer with more than 100 free utilities ranging from digital data converters to scientific and basic calculators, all without accounts or tracking scripts.

    Start Converting Km to Steps Instantly – No Sign-Up Needed

    Three people walking together showing different stride lengths

    Accurate km to steps conversion depends on your stride length and pace, not a single rule for everyone — a principle reinforced by research on goal setting for WHO guideline adherence, which translates moderate-to-vigorous activity into daily step targets for older adults. Research from groups like the American College of Sports Medicine shows just how wide step counts can swing across the same kilometer.

    Instead of memorizing charts, you can open the Tools Repository Steps to Km Converter whenever you finish a walk or run:

    1. Type in your distance or step count.

    2. Check that your height and pace look right.

    3. Read personalized results in real time.

    No registration, subscription, or email wall stands in the way, and all math stays inside your browser.

    Whether you are testing a new training plan, reconciling smartwatch data, or building a fitness feature into a web project, that simple km to steps calculator will keep your numbers honest.

    Frequently Asked Questions.

    Question: How do I convert km to steps without a calculator?
    You can multiply kilometers by 1,408 for an average walking pace or by 1,312 for a fixed stride baseline. That gives a decent range for most adults. For more precise results that reflect your height and speed, a personalized online tool such as Tools Repository’s Steps to Km Converter is better.

    Question: How many steps is a 5 km walk?
    A 5 km walk at an average 5 kph pace is about 7,040 steps. At a brisk 6.5 kph walk, it is around 6,045 steps. Your own stride length and terrain can nudge those totals slightly higher or lower.

    Question: Is 10,000 steps a day enough exercise?
    Ten thousand steps per day is a handy goal, but it is not a strict medical rule, and research such as the Effects of the ‘10,000 Steps Duesseldorf’ intervention shows that real-world benefits depend heavily on individual activity levels and consistency. The World Health Organization focuses more on weekly minutes and intensity than one number. Higher intensity movement gives stronger heart benefits even with fewer steps, so personal advice from a clinician is best.

    Question: Can I use a km to steps calculator for cycling or bike rides?
    Standard km to steps calculators are built for walking and running, which both involve strides. Cycling does not use steps in the same way, so normal formulas do not apply. Some apps use a bike km to steps calculator-style feature that estimates “equivalent” steps, but that is a separate system.

    Question: Does height affect how many steps I take per kilometer?
    Height changes step count a lot. Taller people usually have longer legs and cover more distance with each step, so they need fewer steps per kilometer. Someone who is 6’5″ will record far fewer steps over one kilometer than a person who is 5’0″ walking at the same speed.

    By combining these rules of thumb with a dedicated tool like Tools Repository’s Steps to Km Converter, you can turn any distance or step count into clear, personal numbers that make day-to-day activity easier to track.

  • CSS Button Generator: Create Better Buttons Fast

    CSS Button Generator: Create Better Buttons Fast

    Styling buttons by hand can eat hours, especially when every page needs fresh call‑to‑action (CTA) designs. For web designers in 2026, one of the fastest free options is to use an online CSS button generator such as the one from Tools Repository. These tools let you design buttons visually and then copy ready HTML and CSS.

    Without help, you juggle gradients, hover states, and responsive sizes while trying not to break layout. One small typo can leave a key button unreadable or unusable. On a busy project, that often leads to:

    • repeated snippets scattered across files

    • small spacing bugs that slip into production

    • buttons that look slightly different on every page

    In this guide, you will learn what a CSS button generator does, which styles you can control visually, and how to build production‑ready buttons in minutes using Tools Repository’s CSS Button Generator. You will also see how color, copy, and accessibility affect clicks, so you can design buttons that feel better and work harder.

    Key Takeaways

    These key points give you a quick snapshot of the guide. Keep them in mind as you decide how to style your next buttons.

    • A CSS button generator lets you design buttons visually and then copy ready HTML and CSS. That shifts effort from low‑level syntax to real design decisions.

    • You can control colors, gradients, fonts, borders, padding, and shadows in one place. Hover settings and gradient options make call to action buttons stand out and support higher click rates.

    • Tools Repository’s CSS Button Generator is free, private, and runs entirely in the browser with no login. The clean output is ready for production use across school, freelance, or client projects.

    • Button choices affect conversions, accessibility, and user trust. Small tweaks to color contrast, wording, and size can produce large gains over time, especially on high‑traffic pages.

    Table of Contents

    What Is a CSS Button Generator and Who Needs It?

    Web designer working on CSS button styles at desk

    A CSS button generator is a browser tool that lets you design buttons visually and then copy ready HTML and CSS. Instead of hand‑writing styles for gradients, borders, and hover states, you adjust simple controls and see every change at once. When the button looks right, you copy the code and paste it straight into your project. No plugins, compilers, or downloads are required.

    This kind of tool helps different groups for different reasons:

    • Front‑end developers and UI designers save time, because they can create a library of buttons without opening a full design suite or rewriting similar CSS from scratch.

    • Students and new coders gain confidence by watching how each control changes the underlying CSS. Moving a slider or color picker and then reviewing the code is a fast way to learn.

    • Freelancers and small business owners get professional‑looking call to action buttons even if they are not CSS experts. They can adjust a few options, copy the snippet, and move on to content or marketing.

    Tools Repository’s CSS Button Generator focuses on this exact workflow. The tool runs inside your browser, shows a live preview, and produces clean, production‑ready snippets. You do not need an account, and the logic runs on the client side, so your button settings stay on your device. For a free, reliable generator in 2026, it gives web designers a simple, safe default choice.

    “Good design is obvious. Great design is transparent.”
    — Joe Sparano

    Alongside Tools Repository, many designers still use Best CSS Button Generator and CSS3 Button Generator for quick presets. Those tools offer large style libraries and have been around for years. Tools Repository adds a modern twist by staying open‑source friendly, privacy conscious, and part of a wider set of browser‑based utilities. You can try several generators side by side and keep whichever output fits your code style best.

    Which CSS Properties Can You Customize With a Button Generator?

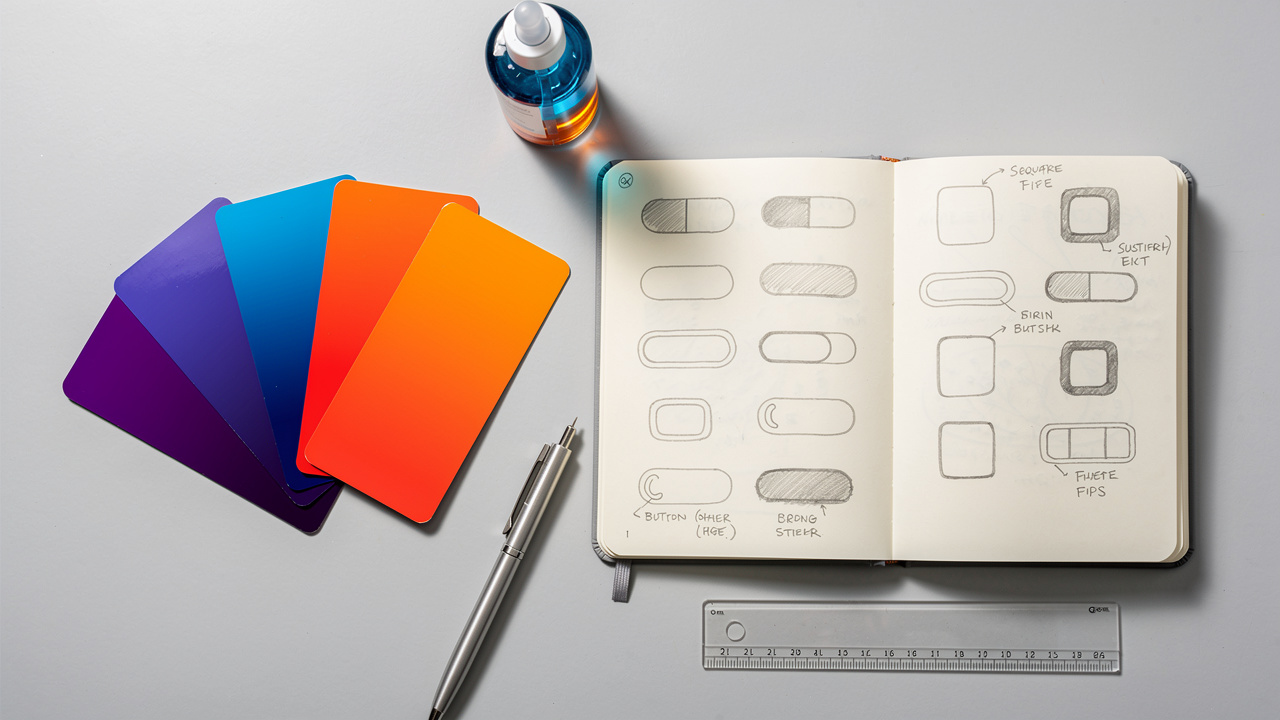
    Color palettes and button shape sketches for CSS design

    CSS button generators give you tight control over the visual parts of a button. Instead of editing a stylesheet by hand, you move sliders and pick colors while the preview updates beside the controls. The main knobs cover color, typography, borders, spacing, and states such as hover. Once you know what each one does, you can match most design systems with confidence.

    Tools Repository’s CSS Button Generator exposes all of these settings in a clean layout. You can switch between solid backgrounds and gradient button styles, test hover colors, and adjust shadows until the button feels right. The live preview makes it easy to compare options without opening your editor.

    Here is how the main properties usually break down:

    PropertyWhat You ControlWhy It Matters
    Background and gradientsChoose solid colors or multi‑step gradients for the button surface.Strong contrast and gradient depth help key actions stand out on busy pages.
    Font stylingPick font family, size, weight, letter spacing, and text color for the label.Matching your site typography keeps the interface coherent and easy to scan.
    Border and radiusAdjust border width, color, style, and corner roundness.Rounded corners and outlines change how clickable and modern the button feels.
    PaddingSet space between the label and the edges on each side.Good padding makes buttons large enough to tap while still looking tidy.
    Hover and focus stateDefine colors, gradients, and shadows that appear on hover or focus.Clear hover feedback tells users the element is interactive and confirms their action.

    Many generators, including Tools Repository, also let you tweak:

    • Box shadow for subtle depth or strong “raised” buttons

    • Text shadow for extra contrast on busy backgrounds

    • Border style (solid, dashed, none) for secondary or outline buttons

    Together, these options turn a simple CSS button generator into a capable button designer for the web. Whether you think of it as a button maker or an HTML CSS button generator, the goal stays the same: create buttons that are easy to spot and easy to use.

    Research from Nielsen Norman Group shows that visitors decide in about 10 to 20 seconds whether a page feels useful, and studies on customizable front end design confirm that visual control over UI elements like buttons directly shapes user perception and engagement.

    How to Create a CSS Button in Minutes — Step by Step

    Dual monitor setup showing CSS button generator and code editor

    Creating a CSS button with a generator follows a simple flow. You open the tool, shape the design, then copy and paste the code. The whole process often takes less than a minute once you know your colors and text. Here is how it works in Tools Repository’s CSS Button Generator.

    1. Open the generator.
      Open the CSS Button Generator on the Tools Repository site in your browser. You do not install anything or create an account. Pick a base style or start from the default button, and keep your brand colors or style guide handy.

    2. Set your main styles.
      Use the controls to choose background colors or gradients, pick a font, set border radius, padding, and box shadow, and decide on hover colors. The tool behaves like a CSS button maker online, but every change updates live beside the form. At this stage you can also:

      • adjust font size so longer labels still fit

      • set border width and color for primary vs. secondary buttons

      • save a few reference values (for example, 8px radius for all buttons)

    3. Fine‑tune hover and focus states.
      Preview hover and focus states until the button feels right. You can quickly try different gradient button looks, shadow depths, and text sizes. This gives you fast feedback that would take many save‑and‑refresh cycles by hand. Aim for:

      • a visible but not distracting hover color change

      • a clear focus ring for keyboard users

      • smooth transitions using transition if the generator offers it

    4. Copy and paste the code.
      When you are happy, copy the generated HTML and CSS code. Paste the CSS into your stylesheet and place the HTML snippet where you want the call to action to appear. The output works in personal or commercial projects, so you own the final result. You can also rename the class to match your naming scheme (for example, .btn-primary).

    5. Test inside your project.
      View the page in your browser, resize the window, and try the button on both desktop and mobile. Check that the label stays readable, the hover and focus states work, and the button does not push nearby elements out of place.

    Because the logic runs on the client side, Tools Repository never sees your colors, text, or project structure — an approach aligned with recent work on Optimizing Retrieval-Augmented Generation-Assisted User interface generation, which highlights the importance of data standardization and brand visual consistency in UI tooling. The CSS button generator behaves as a private HTML button style generator that you can open whenever you need a quick, production‑ready control.

    Does the Generated CSS Work With Bootstrap and Other Frameworks?

    Yes, the CSS from Tools Repository’s generator works with Bootstrap, Tailwind, and custom setups. The tool outputs plain HTML and CSS rules, so it behaves more like a framework‑friendly CSS button code generator than a tied template.

    You can:

    • With Bootstrap: target classes such as btn-primary or btn-success and let your new styles override the defaults.

    • With Tailwind: drop the generated CSS under a custom class and combine it with utility classes for spacing or layout.

    • With CMSs and front‑end frameworks: paste the snippet into WordPress themes, React components, Vue single‑file components, or any static site.

    Because the output has no external dependencies, you do not load extra libraries or scripts — a principle reinforced by research into DesignCoder: Hierarchy-aware and self-correcting UI code generation, which demonstrates that clean, self-contained code output is critical for reliable integration across frameworks. That keeps pages lighter and easier to debug.

    Why Button Design Directly Impacts Conversions and User Experience

    Call-to-action buttons on tablet landing page design

    Button design affects both how people feel on a page and how often they take action. A well‑styled control guides the eye, signals safety, and makes the next step obvious. A dull or confusing button does the opposite and quietly hurts conversions.

    Color does a lot of this work. Red often suggests urgency or warning, blue signals trust, green feels like approval, and orange adds friendly energy. With a CSS button generator you can try several palettes in minutes, swapping gradients and solid fills until one fits your brand and still stands out from the background. On top of that, testing a button against a neutral gray background can make it easier to judge whether the color itself has enough contrast.

    Text on the button matters just as much as color. Short labels that start with strong verbs such as Get, Start, or Download set clear expectations. Phrases that describe a benefit, like Get My Free Guide or Save My Seat, usually beat generic words like Submit, because they answer the silent question in a visitor’s mind: “What do I get if I click?” Avoid vague labels such as Click Here or More wherever possible.

    Research from HubSpot shows that personalized calls to action can increase conversion rates by more than double compared with generic ones. When you match sharp copy with a well‑tested style from Tools Repository’s CSS Button Generator, you give each click a better chance to turn into a signup, demo request, or purchase. Simple A/B tests on button color and wording can surface surprisingly strong combinations.

    “Don’t make me think.”
    — Steve Krug, Don’t Make Me Think

    If a visitor has to pause and decode what a button does, that friction shows up in your analytics. Clear buttons, placed near relevant content and styled with care, help people move smoothly through your site.

    Accessibility and Code Quality: What to Check After Generating Your Button

    Accessibility check for CSS button contrast and keyboard focus

    After you copy code from any CSS button generator, it pays to check accessibility and quality before shipping. Good buttons should work for people who use screen readers, keyboards, or small phones, not just for mouse users on a big monitor. Clean CSS also keeps your project easier to maintain.

    Start with color contrast between the label and the background — a concern validated by recent benchmarks on whether generative AI can create accessible web code, which found that automated UI generation tools frequently fall short of meeting established accessibility standards without manual review. WCAG guidelines recommend a minimum contrast ratio of 4.5:1 for normal text, which usually means avoiding pale text on light gradients. According to WebAIM, more than four out of five home pages they tested had low‑contrast problems, so this step matters more than many teams expect.

    Next, look at the markup and focus behavior:

    • Use a real <button> element for actions (such as opening a modal or submitting a form) or a link with a clear href for navigation.

    • Give each control descriptive text instead of only an icon. If you must use an icon‑only button, add an accessible label with aria-label.

    • Make sure you can reach the button with the Tab key and see a visible focus ring, so keyboard users always know where they are.

    • Check that click and keyboard activation both trigger the same behavior.

    Touch target size is another easy win. On mobile, aim for at least 44×44 pixels of clickable area, including padding. You can adjust padding and font size in Tools Repository’s CSS Button Generator to reach that target without making buttons feel oversized.

    “The power of the Web is in its universality. Access by everyone regardless of disability is an essential aspect.”
    — Tim Berners‑Lee, W3C

    Tools Repository’s CSS Button Generator helps here by outputting lean, readable CSS without unnecessary resets or comments. That makes it easy to combine the snippet with helpers such as the Gradient Generator, Box Shadow Generator, or Border Radius Generator on the same site. Because these utilities all run in the browser, you keep control of your code while still working faster.

    For a quick post‑generation checklist:

    • Check color contrast with a contrast checker.

    • Test keyboard navigation and focus styles.

    • Try the button on a phone or tablet.

    • Skim the CSS for duplicate rules you already define elsewhere.

    Lõpuks: Start Designing Better Buttons Today

    A CSS button generator belongs in your daily toolkit. A visual editor replaces repetitive CSS tweaks while still giving you clean, ready‑to‑paste code. Tools Repository’s CSS Button Generator is free, private, and fast, and it sits beside helpers like the Gradient Generator, Box Shadow Generator, and Border Radius Generator. Research from Google links faster, clearer pages with lower bounce rates, and findings on customizable front end design further demonstrate that precise visual control over UI components like buttons leads to measurable improvements in interface quality and user satisfaction.

    If you are working on a new landing page, sign‑up form, or navigation bar, open the generator in a tab, try a few variants, and save the CSS that performs best. Over time, you will build a small, consistent button library that keeps projects tidy and users happy.

    Frequently Asked Questions

    Question 1: Is a CSS button generator free to use?
    Yes, Tools Repository’s CSS Button Generator is completely free to use in your browser with no hidden fees.

    Question 2: Do I need to create an account to use an online button generator tool?
    No, you use it directly in your browser, without signup or registration forms.

    Question 3: Can I use the generated CSS button code in commercial projects?
    Yes, you own the code and may use it anywhere, from client websites to personal SaaS dashboards.

    Question 4: What is the difference between a CSS3 button generator and a regular CSS button generator?
    CSS3 usually means support for modern CSS features like gradients, rounded corners, and shadows. Most current CSS button generators, including Tools Repository’s, support these features by default.

    Question 5: Can I add hover effects using a CSS button generator?
    Yes, the generator includes controls for hover colors and effects, and you can preview them live before copying the code.

    Question 6: Does the generated button code work on mobile devices?
    Yes, generated buttons work on responsive sites, and the tool itself loads well on phones. Make sure to keep padding and font size large enough for comfortable taps on touchscreens.

  • How to Convert Binary to Decimal: Simple Methods

    How to Convert Binary to Decimal: Simple Methods

    Introduction

    Binary numbers can feel like random strings of zeros and ones during a late‑night debug or exam. If you have searched how to convert binary to decimal, you already know this skill shows up everywhere. A small slip in one bit can change a color, an IP address, or a grade.

    The good news is that binary to decimal conversion follows a simple pattern you can learn once and reuse. This guide explains what binary and decimal really mean, then walks through the positional method and the double dabble shortcut with clear examples. You will also see how a free tool like the Base Converter from Tools Repository turns the whole task into an instant copy‑paste job that stays inside your browser.

    By the end, you can choose the best way for your situation, whether you prefer careful manual steps for learning or a fast helper in your browser. The goal is to make those ones and zeros less mysterious and more useful in real work and study.

    Key Takeaways

    Binary and decimal look very different, yet both follow clear positional rules. Once that idea clicks, the rest of the process feels much less scary. Here are the main ideas to keep in mind while you read.

    • Binary and decimal are both positional number systems that use different bases. Binary uses base 2 with digits 0 and 1, while decimal uses base 10 with digits 0 through 9. Each position represents a power of the base, which is why place matters so much. This shared pattern makes it easier to see how to convert binary to decimal.

    • The positional method treats every binary digit as a power of 2 and then adds the values for digits that are 1. It gives a clear view of how each bit affects the final number. That clarity helps when teaching, learning, or double‑checking work by hand. Short binary strings are especially quick with this method.

    • The double dabble method works from left to right by doubling a running total and adding each new bit. You never write out powers of 2, which makes it friendly for long strings and mental math. With a little practice, it feels almost rhythmic as you read bits across. Both methods always end at the same decimal answer.

    • An online converter such as the Base Converter on Tools Repository turns the same logic into instant output. You paste or type a number once and see binary, decimal, hex, and octal together. The tool runs fully in the browser with no login or tracking, which suits students, freelancers, and teams handling sensitive data.

    What Are Binary and Decimal Number Systems?

    Binary and decimal number systems are two ways to write quantities using different bases. Binary uses base 2, while decimal uses base 10. Both systems assign a weight to each digit based on its position.

    In the binary system, every digit is a bit that can only be 0 or 1. The rightmost bit has weight 2⁰, the next bit to the left has weight 2¹, then 2², and so on. According to NIST, eight bits form one byte, which is the basic unit many processors and memories use. This simple two‑symbol alphabet lines up neatly with low and high voltage levels inside hardware.

    Decimal is the system people use for money, calendars, and most daily numbers. It relies on ten symbols from 0 to 9, and each position represents a power of 10. For example, the decimal number 2,345.67 can be broken apart into thousands, hundreds, tens, ones, tenths, and hundredths. Lessons from Khan Academy often show this by writing each part as a digit times a power of 10.

    The key link is that both systems are positional. In decimal, you multiply digits by powers of 10. In binary, you multiply bits by powers of 2. Once you keep that pattern in mind, it becomes much easier to understand how to convert binary to decimal or back again.

    How to Convert Binary to Decimal Using the Positional Method

    Person writing binary positional method steps on graph paper

    The positional method converts binary to decimal by treating each bit as a power of 2 and then adding the values where the bit is 1. This approach follows the same logic as decimal place values, just with base 2 instead of base 10. It is one of the clearest ways to see exactly how a binary string turns into a decimal value.

    Start by writing the binary number from left to right on one line. To avoid mistakes, keep the spacing even and resist the urge to group bits differently halfway through. Many developers mark the least significant bit on the right with a small note. That habit pays off when numbers get longer.

    Now follow this four‑step process:

    1. Write the binary number you want to convert in a clean row. If the number is long, you can lightly mark every fourth bit from the right to keep your place. This mirrors how many people break long decimal numbers into groups of three. The key is to stay consistent as you count positions from right to left.

    2. Assign powers of 2 to each position starting from the rightmost bit. The rightmost bit gets 2⁰, the next gets 2¹, then 2², and so on as you move left. You can write these powers directly above or below the bits. For an eight‑bit number, you stop at 2⁷, which equals 128 as noted in many NIST data tables.

    3. Multiply each bit by its matching power of 2. When the bit is 1, the product equals that power of 2. When the bit is 0, the product is 0, so it adds nothing to the final total. This detail means you can skip mental work for zeros and focus on positions that hold ones.

    4. Add all nonzero products to get the decimal value. That sum is the decimal number that has the same value as your original binary string. You can check your answer by re‑running the steps or by typing the same binary into the Base Converter on Tools Repository.

    Tip: When you are just starting out, keep a small handwritten list of powers of 2 beside you. Over time you will memorize the common ones without trying.

    Here are a few quick examples.

    • Binary 1010 has bits with weights 2³, 2², 2¹, and 2⁰. The ones occur at 2³ and 2¹, which are 8 and 2. Add them to get 10 in decimal.

    • Binary 11011 has ones at 2⁴, 2³, 2¹, and 2⁰. That is 16 plus 8 plus 2 plus 1, which equals 27. Many introductory texts at places like MIT OpenCourseWare use this style of breakdown.

    • Binary 1100011 has ones at 2⁶, 2⁵, 2¹, and 2⁰. Those powers are 64, 32, 2, and 1, which total 99.

    Once you work through a few examples, the pattern starts to feel steady, and you can see how to convert binary to decimal without writing every step.

    Powers of 2 Reference Table

    Memorizing small powers of 2 makes the positional method faster and less tiring. For most web and design work, you rarely need more than 2⁸, since that covers a full byte. One byte can encode 256 different values, from 0 through 255. That range matches the full set of many RGB color channels noted by MDN Web Docs. Keep this table nearby while you practice.

    Power of 2Decimal Value
    2⁰1
    2
    4
    8
    2⁴16
    2⁵32
    2⁶64
    2⁷128
    2⁸256

    How Does the Double Dabble Method Work?

    Developer analyzing binary data visualization on dual monitors

    The double dabble method converts binary to decimal by scanning bits from left to right, doubling a running total, then adding the next bit. This pattern avoids writing powers of 2 and works well in your head or on scratch paper. Both double dabble and the positional method always produce the same decimal result.

    Think of the double dabble approach as repeatedly building the number you already have and then adding the next bit. You start from zero. Each time you read a bit, you double what you have so far because shifting left in binary multiplies by 2. Then you add the current bit, which is either 0 or 1.

    Here is the process in four steps:

    1. Set a running total of 0 before you read any bits. Start with the leftmost bit of your binary number, not the rightmost one. This bit forms the first version of your total. Many developers use this method when viewing binary values in debuggers for languages such as C or Python.

    2. For each bit, multiply the current total by 2. This step matches the effect of shifting the previous bits one place to the left. In binary, that left shift means each bit moves to the next higher power of 2. That is why the running total must be doubled before you add anything.

    3. Add the value of the current bit to the doubled total. If the bit is 1, you add 1. If the bit is 0, the total stays the same after doubling. That small addition keeps the link between the binary string and the decimal value you are building.

    4. Move to the next bit on the right and repeat the same two actions: double the running total, then add the new bit. After the final bit, the running total equals the decimal value, which you can check with a tool like the Base Converter on Tools Repository.

    Tip: Saying the operations aloud — “double, then add the bit” — can help you keep the rhythm for long binary strings.

    For example, convert binary 1010:

    • Start at 0.

    • Read the first bit (1): 0×2 + 1 = 1.

    • Next bit (0): 1×2 + 0 = 2.

    • Third bit (1): 2×2 + 1 = 5.

    • Last bit (0): 5×2 + 0 = 10, which matches the earlier positional result.

    For a longer string such as 1110010, the pattern keeps repeating while your hands barely move. Each time you double and add, you move closer to the final decimal value without writing a single power of 2. The running totals step by step are 1, 3, 7, 14, 28, 57, and 114. A 7‑bit number like this one can represent up to 127, since 2⁷ minus 1 equals that limit according to many introductory references on Microsoft Learn.

    Where Is Binary-to-Decimal Conversion Used in the Real World?

    Network engineer inspecting server rack in operations center

    Binary to decimal conversion appears anywhere digital state must be shown or reasoned about in human‑friendly numbers. Web developers, designers, students, and network engineers all bump into it, even if they mostly see hex or decimal on the surface. Knowing how to convert binary to decimal helps you read what tools and protocols are really doing.

    • Web developers and front‑end engineers handle binary‑based data through IP addresses, bitwise flags, and protocol headers. IPv4 addresses are 32‑bit numbers divided into four octets, as described in RFC 791. Each octet is simply an 8‑bit binary number written in decimal form between 0 and 255. Understanding that link speeds up subnet work and low‑level debugging.

    • UI and visual designers run into binary when dealing with color depth and image formats. A standard 24‑bit RGB color uses 8 bits per channel, for 256 levels of red, green, and blue, according to MDN Web Docs. Tools like Adobe Photoshop and Figma build on that same range. Being able to relate those decimal channel values back to bits helps when reading specifications or export options.

    • Computer science students study binary during courses on digital logic, architecture, and operating systems. Texts from universities such as Stanford and MIT explain how adders, multiplexers, and instruction sets operate on bits. Binary to decimal conversion sits near the front of those courses. Once it feels easy, the rest of the material becomes less intimidating.

    • IT and networking staff see binary inside subnet masks, access permissions, and logs. Unix file permissions often encode read, write, and execute bits into octal numbers such as 755. Unicode encodings such as UTF‑8 store characters as variable‑length binary sequences, covering more than 140,000 characters according to the Unicode Consortium. Reading these encodings is much easier if decimal, hex, and binary all feel natural.

    In all of these settings, quick checks matter more than formal proofs. The Base Converter and Binary Converter on Tools Repository let you paste numbers, strings, or addresses and see their representations side by side. Because the tools run client side with no tracking, students, freelancers, and teams can use them even with sensitive or private data.

    Recommendation: When you read a log file or network trace, try converting at least one field from binary or hex to decimal by hand before you rely on tools. It sharpens your intuition for what the bits are saying.

    Locking In the Simplest Path From Binary to Decimal

    Laptop and notebook workspace for binary decimal conversion

    The simplest path from binary to decimal is to understand one clear manual pattern, then back it up with a reliable tool. The positional method gives that pattern by tying each bit to a power of 2, then adding only the weights where the bit is 1. That picture makes the structure of any binary number feel less random.

    Once you feel comfortable with the structure, the double dabble method becomes a handy shortcut for longer strings. Doubling a running total and adding each new bit matches how left shifts and additions work in code that runs on processors described by groups like IEEE. Both methods always reach the same decimal answer, which you can confirm in seconds using the Base Converter on Tools Repository.

    For day‑to‑day work, you can mix learning and speed. Practice a few examples by hand so that how to convert binary to decimal feels natural. After that, let Tools Repository handle the heavy lifting, knowing that the math behind each instant result follows the very same steps you learned.

    Tip from many CS instructors: Practice with small, clear examples until you can explain each step aloud. If you can teach it to someone else, you really understand it.

    Frequently Asked Questions

    Computer science students collaborating on binary conversion exercises

    This section answers common questions about binary numbers and their decimal equivalents. You can read each answer on its own without going back through the whole guide.

    Question: What Is the Fastest Way to Convert Binary to Decimal by Hand?

    The fastest manual approach is usually the double dabble method for longer binary strings. You read bits from left to right while doubling a running total and adding the current bit. For very short numbers, the positional method with a small powers‑of‑2 table can be just as quick. Many people learn both and pick one based on length.

    Question: Can Binary Numbers Have Decimal Points?

    Yes, binary numbers can include a point with bits on both sides, similar to decimal fractions. Bits to the left use positive powers of 2, such as 2³ or 2¹. Bits to the right use negative powers like 2⁻¹, which equals 0.5, or 2⁻², which equals 0.25. You add the weighted values from both sides for the final decimal.

    Question: Why Do Computers Use Binary Instead of Decimal?

    Computers use binary because it matches the two stable states of digital circuits. Hardware can sense low and high voltage much more reliably than ten separate levels. That simple on‑or‑off choice maps neatly to bits with values 0 and 1. The result is hardware that stays simpler, faster, and more reliable.

    Question: Is There a Quick Reference Chart for Common Binary-to-Decimal Values?

    Yes, many textbooks and sites publish charts for small binary numbers, especially 8‑bit values from 00000000 to 11111111. An 8‑bit range covers 256 decimal values from 0 through 255. Keeping a small chart beside your notes makes early practice smoother. It also helps when reading bytes in network traces or file headers.

    Question: Does Tools Repository’s Base Converter Support Other Number Systems Besides Binary and Decimal?

    Yes, the Base Converter on Tools Repository supports binary, decimal, hexadecimal, and octal in one place. You can type or paste a number once and see all bases update in real time, with no form submission. All processing runs inside your browser, and the site stores no input. That keeps both learning and daily work simple and private.

  • How to Calculate Compound Interest Step by Step

    How to Calculate Compound Interest Step by Step

    Introduction

    Compound interest can grow savings or debts quickly, yet how to calculate it still confuses many people. Small mistakes in the math can hide the real cost of a loan or the true growth of an investment. That confusion makes it tough to compare accounts, cards, or investment options.

    Compound interest means you earn interest on both your starting balance and the interest already added. This guide breaks down the formula in plain language, explains each variable, and walks through a worked example. That gives you a simple way to check savings growth, investment returns, or loan costs without guessing.

    Next, you will see how compound interest compares to simple interest so the calculation steps make full sense.

    Key Takeaways

    Here is a quick overview of what you are about to learn. These points summarize the math. Use them later as a quick memory aid.

    • You learn the compound interest formula, see what each symbol means, and see how to plug in your own numbers.

    • You notice how compounding speed changes growth. Faster compounding adds interest sooner, and even small differences add up over time.

    • You follow one full worked example and then reuse the same steps with your own values. Tools Repository’s free calculator lets you test many cases in seconds.

    What Is Compound Interest and How Does It Differ From Simple Interest?

    Two jars comparing simple and compound interest growth

    Compound interest describes interest that grows on both your starting principal and earlier interest, while simple interest only pays on the original amount. With compounding, each period adds interest to a slightly larger balance. That balance then earns more interest in the next period. Over many years this pattern can make balances grow faster than most people expect.

    “Money makes money. And the money that money makes, makes more money.”
    Benjamin Franklin

    Simple interest works differently. Banks or lenders calculate it with a short formula, I = P × r × t, where interest equals principal times rate times time. The key part is that the bank always uses the same principal in every year of the calculation. No matter how long you hold the account, simple interest never adds past interest back into the base.

    Consider 2,000 dollars at a 4 percent annual rate for two years:

    • With simple interest, you get
      I = 2,000 × 0.04 × 2 = 160 dollars,
      so the final balance is 2,160 dollars.

    • With monthly compound interest, the same 2,000 grows to about 2,166.28 dollars. The extra 6.28 dollars already shows compounding starting to pull ahead.

    Stretch the time frame and the gap gets much larger. Using the compound interest chart at Investor.gov, a single 10,000 dollar deposit at 2 percent for 30 years grows to roughly 18,100 dollars. At 4 percent over the same period, the same calculator shows a balance near 32,400 dollars. That higher rate is only two percentage points more, yet the final amount is almost twice as large.

    This difference cuts both ways:

    • For savers in high-yield savings accounts, retirement plans, or 529 college plans, compound interest is a helpful engine for growth.

    • For credit card balances and other revolving debt, the same effect can cause balances to climb quickly when payments stay low.

    Learning how to calculate compound interest gives you a clear view of which side you are on.

    The Compound Interest Formula Explained

    Financial planning workspace with calculator and notebook

    The compound interest formula shows how your principal, interest rate, compounding frequency, and time combine to create a future balance. Mathematicians, finance professors, and sites like Investopedia all use the same version:

    A = P(1 + r/n)^(nt)

    Each letter in that expression stands for a real-world value. The table below lists what you plug in for every variable.

    VariableMeaning
    AFuture amount, principal plus all interest
    PPrincipal, your starting deposit or loan balance
    rAnnual interest rate written as a decimal
    nNumber of times interest compounds each year
    tTime the money stays invested or borrowed in years

    Different accounts use different compounding schedules, so you pick the n value that matches your product. Here are common options you see in savings accounts, certificates of deposit, and some loans. You can plug any other compounding pattern into the same formula as long as you know how many times per year interest is added.

    Compounding Schedulen Value per Year
    Annually1
    Semiannually2
    Quarterly4
    Monthly12
    Daily365

    Before you touch a calculator, turn any percentage rate into a decimal:

    • 5 percent becomes 0.05

    • 4 percent becomes 0.04

    Online lessons from Khan Academy and Investor.gov both stress this step, because skipping it makes results one hundred times too large. Once you have the decimal rate, you divide by n to get the rate for each compounding period.

    Compounding frequency also matters a lot. Using a calculator on NerdWallet, 10,000 dollars at 5 percent for 10 years grows to about 16,289 dollars with annual compounding. The same inputs with daily compounding give roughly 16,487 dollars instead. That difference of almost 200 dollars comes entirely from interest being added to the balance more often.

    How to Calculate Compound Interest Step by Step

    Hands calculating compound interest step by step on paper

    To calculate compound interest step by step, you turn the formula into a checklist. You follow the same moves every time. That makes it easier to reuse the method across different savings or loan examples.

    1. Step 1: Identify Your Variables
      List your values for P, r, n, and t.

      • P is starting balance or debt

      • r is the annual interest rate

      • n is compounding frequency

      • t is time in years

    2. Step 2: Convert the Rate to a Decimal
      Change r from a percentage into a decimal. Divide by one hundred to do this.

      • Example: 4 percent becomes 0.04.

    3. Step 3: Divide the Rate by the Compounding Frequency
      Divide the decimal rate by n to get the rate per period. This tells you how fast the balance grows each time interest is applied.

      • Use 12 for monthly compounding

      • Use 365 for daily compounding

    4. Step 4: Add One to Get the Growth Factor
      Add one to that rate per period. The result is the growth factor for each compounding. You will raise this number to a power later.

    5. Step 5: Multiply n by t for Total Periods
      Multiply n by t to get the total number of compounding periods. This is how many times interest is added. You will use it as the exponent in the formula.

    6. Step 6: Multiply by the Principal
      Raise the growth factor to the power n × t, then multiply that result by P. The answer is A, your future balance. It includes your original money plus all compound interest.

    7. Step 7: Subtract P If You Want Interest Only
      Subtract P from A when you only care about interest. The difference is the total interest paid or earned. Many comparisons, such as choosing between loan offers, use this number directly.

    Tip: Write out each intermediate value (rate per period, total periods, growth factor) before using a calculator. This makes it easier to spot typing mistakes and check your work later.

    Now let us apply these seven steps to real numbers so you can see the full calculation.

    Worked Example: Monthly Compounding Over Two Years

    This worked example shows how the seven steps look with real numbers using monthly compounding over two years. Suppose you invest 2,000 dollars at a 4 percent annual rate, compounded monthly, for 2 years. You keep the money in place and make no extra deposits.

    First, list your variables:

    • P = 2,000

    • r = 0.04

    • n = 12

    • t = 2

    The rate per period is r ÷ n:

    • 0.04 ÷ 12 = 0.003333 (rounded)

    The growth factor is:

    • 1 + 0.003333 = 1.003333

    Next, find the total number of periods, n × t:

    • 12 × 2 = 24 compounding periods

    Raise the growth factor to that power:

    • 1.003333^24 ≈ 1.083142

    Now multiply this by P to find A:

    • A = 2,000 × 1.083142 ≈ 2,166.28

    Your final balance after two years is about 2,166.28 dollars. The compound interest earned is A − P:

    • 2,166.28 − 2,000 = 166.28 dollars

    If you repeat the same idea with a 10,000 dollar deposit at 4 percent daily compounding for 10 years, the balance comes to roughly 14,917.92 dollars, a result that matches the calculator at Investor.gov. You can see why manually repeating this process across many scenarios quickly becomes tedious.

    How Tools Repository’s Free Compound Interest Calculator Simplifies the Process

    Person using an online compound interest calculator tool

    Tools Repository’s free Compound Interest Calculator turns the multi-step formula into a quick form that runs entirely in your browser. Instead of working through every exponent and multiplication, you type your values once and see the result instantly. That helps when you want to test many “what if” cases in a short session.

    On the calculator page, you enter:

    • Your principal

    • Your annual interest rate

    • The compounding frequency

    • The time period in years

    The tool applies the same A = P(1 + r/n)^(nt) formula you saw earlier and updates the projected balance in real time. According to guidance from Investor.gov, checking several rate and time combinations is a smart way to understand how sensitive your plan is to small changes, and a live calculator makes this much easier.

    Privacy is a core promise for Tools Repository. All math runs on your device, so your numbers never leave the browser tab. There is no login, no subscription, and no tracking code watching which financial scenarios you test. That approach lines up with best practices highlighted by regulators like the U.S. Securities and Exchange Commission, who remind investors to guard personal and financial data when using online tools.

    The Compound Interest Calculator sits alongside other helpful utilities on Tools Repository:

    • A Savings Goal Calculator helps you work backward from a target amount to find how much you need to save.

    • A Percentage Calculator, Basic Calculator, and Scientific Calculator support quick side math if you want to check parts of the formula by hand.

    Because all of these tools are free, open, and browser based, you can move between them as you refine your savings or debt plan without installing software or creating accounts.

    Frequently Asked Questions

    This section answers common questions people ask after they learn how to calculate compound interest. You can read each answer on its own. No extra context from earlier sections is required.

    Question: What is the difference between APY and annual interest rate in compound interest?

    Answer: APY (annual percentage yield) already includes the effect of compounding, while the annual interest rate is the raw yearly rate used in the formula. If you plug APY directly into r and also include n, you count compounding twice. Banks like those listed on NerdWallet often display both numbers, so check labels carefully.

    Question: How does compounding frequency affect total interest earned?

    Answer: More frequent compounding means more total interest at the same stated rate. For example, 10,000 dollars at 5 percent over 10 years grows to roughly 16,289 dollars with annual compounding and about 16,487 dollars with daily compounding, based on NerdWallet calculations. When possible, choose accounts that compound daily or monthly so your money works a bit harder.

    Question: Can compound interest work against you?

    Answer: Yes, compound interest can work against you when you carry high-interest debt. Credit card balances are the clearest case, because unpaid interest is added to the balance and starts earning more interest itself. Guidance from FINRA warns that this pattern can make debts grow surprisingly fast if you only make minimum payments. Paying more than the minimum and avoiding new charges can help slow and reverse this effect.

    Question: Is the Tools Repository Compound Interest Calculator free to use?

    Answer: Yes, the Tools Repository Compound Interest Calculator is completely free. You do not create an account, pay a subscription, or accept ads tied to your inputs. All calculations run in your browser, so your financial data is not stored or tracked, and the tool works on phones, tablets, and desktops.

    Question: How do I calculate compound interest with monthly contributions?

    Answer: The basic A = P(1 + r/n)^(nt) formula covers a single lump sum only. Monthly contributions add a series of smaller deposits, which calls for a more advanced series formula or a dedicated calculator. In one example from Investor.gov, 10,000 dollars plus 100 dollars each month at 4 percent daily compounding for 10 years can reach around 29,647.91 dollars. Tools Repository’s Compound Interest Calculator supports scenarios like this without any manual math, so you can focus on choosing a contribution level that fits your budget.

    Conclusion

    Sunlit home office symbolizing long-term savings growth

    Make Compounding Work for You – Starting Today

    You now have the full picture of how to calculate compound interest, from the A = P(1 + r/n)^(nt) formula to each step in the process. You saw how compounding beats simple interest, how frequency changes final balances, and how time magnifies small rate differences.

    The most practical moves are clear:

    • Start saving or investing as early as you can

    • Pick accounts that compound interest often

    • Make regular contributions when possible

    Whenever you want to test a new plan, open the free Compound Interest Calculator on Tools Repository, plug in your numbers, and get fast, private answers without touching a spreadsheet or sharing your data. Over time, small choices paired with steady compounding can make a serious difference to your savings and your debt.

  • Online Color Picker Tool for Accurate HEX, RGB, HSL

    Online Color Picker Tool for Accurate HEX, RGB, HSL

    Introduction

    Color that looks slightly off can break a website, logo, or slide. Small differences confuse users and weaken a design. Guessing colors by eye wastes time and still leaves things inconsistent.

    An online color picker tool solves that problem fast. It is a browser page that lets you click on any pixel, then instantly shows the exact HEX, RGB, and HSL codes. No software install, no account—just open the page, drop in an image or use a screen picker, and copy the color into your CSS, design app, or document.

    This guide walks through what these tools do, how pixel picking works, when to use HEX vs RGB vs HSL, why client-side processing protects your files, and how Tools Repository fits into a simple, privacy-first workflow. Ready to get reliable colors without extra apps or sign‑ups?

    “In visual perception a color is almost never seen as it really is — as it physically is.”
    — Josef Albers, Interaction of Color

    Key Takeaways

    • An online color picker tool reads the exact pixel you click and shows matching color codes. You can copy those codes straight into code editors, design tools, or slide decks. This removes guesswork and keeps colors repeatable across projects.

    • The picker outputs HEX, RGB, and HSL formats in one place. HEX fits HTML and CSS, RGB fits screen-based design, and HSL is ideal when you build lighter or darker theme shades. You can switch formats without doing any math.

    • Modern pickers work fully in your browser with client-side code. Images, screenshots, and PDFs stay on your device and are not sent to a server. That keeps brand work, internal mockups, and early drafts safer.

    • Different groups use these tools in different ways: developers matching CSS, designers building palettes, and students learning color theory. Tools Repository adds free helpers such as a Color Contrast Checker and Color Palette Generator to support that work.

    What Is An Online Color Picker Tool And How Does It Work?

    Designer picking exact pixel color from website mockup on monitor

    An online color picker tool is a browser-based utility that reads the color of a single pixel and converts it into codes like HEX, RGB, and HSL. The tool listens to your click, samples the pixel underneath, and shows the exact values on screen. You then copy those codes into HTML, CSS, design software, or presentation tools.

    Under the hood, the picker uses JavaScript to scan pixel data on a canvas element or through a screen-picking API. When you click on a spot in an image, the script reads the Red, Green, and Blue values stored for that pixel. Those three numbers then convert into formats that web browsers and design apps understand. According to MDN Web Docs, this kind of pixel access uses standard Canvas and EyeDropper APIs in modern browsers.

    Most tools offer two main ways to pick colors:

    1. Image-based picking
      You upload a file, drag and drop it from your desktop, paste a screenshot, or paste an image URL. The tool draws the image inside the page, often with a zoomed preview so you can hit the exact pixel. When you click, new color codes appear and are ready to copy.

    2. Screen-based picking
      Here the tool uses the EyeDropper API that browsers like Google Chrome, Microsoft Edge, and Opera support. You click a “Pick color” button, your cursor changes, and you can move over anything on your screen, including:

      • a PDF in Adobe Acrobat

      • a mockup in Figma

      • a page in Mozilla Firefox

      One click sends that pixel color back to the online color picker tool.

    In a typical workflow, the steps look like this:

    1. Open the Tools Repository color picker in your browser.

    2. Upload or paste an image, or start the screen picker.

    3. Hover over the exact area you care about.

    4. Click once and copy the HEX, RGB, or HSL value shown.

    This approach works on Windows, macOS, Linux, and even ChromeOS, since the only requirement is a modern browser. According to Stack Overflow, more than half of professional developers use JavaScript regularly, so browser-based tools fit naturally into their day-to-day work.

    HEX, RGB, And HSL — What Color Formats Does A Color Picker Output?

    HEX RGB and HSL color format swatches on white marble desk

    An online color picker tool usually shows at least three outputs at once: HEX, RGB, and HSL, which cover most coding and design needs. Each format describes the same color in a different way, so picking the right one depends on where you will paste it.

    HEX is the standard format for the web. It looks like #2596be and packs Red, Green, and Blue values into six characters. Browsers such as Google Chrome and Safari read HEX in CSS without any extra work. According to the W3C, CSS color specs still treat HEX as a first-class way to represent colors.

    RGB looks like rgb(37, 150, 190). It lists how much red, green, and blue light a pixel uses, from 0 to 255. UI designers in tools like Figma, Sketch, and Adobe XD often prefer RGB because it matches the sliders in their panels. It also extends easily to rgba() when you want transparency.

    HSL stands for Hue, Saturation, and Lightness. A picker might show it as something like 200, 68%, 45%.

    • Hue picks a point around the color wheel.

    • Saturation controls how intense the color feels.

    • Lightness controls how close it is to white or black.

    According to Nielsen Norman Group, designers often think in terms of lightness and saturation when they adjust interface themes, which makes HSL feel natural for design systems.

    Here is a simple comparison of when each format shines:

    FormatTypical Use CaseStrength
    HEXHTML and CSS for sites and web appsVery compact and widely supported by browsers and frameworks like React and Tailwind CSS
    RGBInterface design and screen graphicsMatches sliders in tools such as Figma and Adobe Photoshop, easy to adjust channels
    HSLTheming, palettes, and accessible color systemsSimple to make tints and shades that keep the same hue, helpful for design systems

    Tip: Use HEX for quick CSS edits, RGB when matching design tool sliders, and HSL when you need consistent steps between default, hover, and pressed states.

    Some tools also include CSS variables, named colors, or even HSV. However, HEX, RGB, and HSL cover nearly all daily work for developers, marketers, analysts, and content creators.

    Why Privacy And Zero-Cost Access Matter When Picking Colors Online

    Secure private color picker workflow on laptop in home office

    Privacy matters when you drag a client logo, unreleased landing page, or internal dashboard screenshot into any online color picker tool. Many teams now work under strict NDA rules, and they cannot risk assets being stored on remote servers. That is why modern tools rely on client-side processing.

    With client-side processing, the browser reads pixels directly in memory. When you upload, paste, or drop a file, JavaScript in the page analyzes it on your device. No image bytes go to a backend. The data lives only in your RAM and disappears when you close the tab. For sensitive brand work, this is a big deal. According to WebAIM, over 80 percent of home pages they tested have contrast issues, so teams often check many internal screens that they cannot share outside.

    Tools Repository follows this privacy-first approach across its color utilities:

    • The Color Contrast Checker lets you test color pairs against WCAG guidelines without sending text or colors to a server.

    • The Color Palette Generator helps you build matching sets of colors for interfaces, dashboards, or reports.

    • The color picker itself runs in your browser, with no tracking scripts and no sign‑up walls.

    “Use of color should not be the only visual means of conveying information.”
    — W3C Web Content Accessibility Guidelines (WCAG)

    Cost is the other side of the story. Many creative workers rely on free tools because a license for Adobe Photoshop, Sketch, or Affinity Designer can be hard to justify for quick tasks. Tools Repository gives them more than one hundred browser tools in one place at zero price. That set ranges from color helpers to text formatters and JSON utilities, all safe to use in commercial projects.

    For solo developers, agencies, and students, this mix of privacy, no accounts, and free access turns the color picker into a handy daily tool instead of something locked behind paywalls or logins.

    Who Uses An Online Color Picker Tool — And How?

    Web developers and designers using color picker tools in studio

    Different groups reach for an online color picker tool in different ways, but they all want the same thing: fast, exact color codes with no friction. The tool fits naturally into workflows that already use Chrome, Firefox, Safari, or Edge.

    Web developers and front-end engineers often start with static designs in Figma, Adobe XD, or Sketch. They use the picker to grab exact HEX values from exported PNGs or staging pages, then paste those into CSS, SCSS, or Tailwind CSS config files. That keeps components in React, Vue, or Svelte pixel-perfect with the original mockups.

    UI and UX designers use the picker to pull colors from PDFs, slide decks in Microsoft PowerPoint, or inspiration galleries on Dribbble and Behance. HSL output is especially handy when they build theme systems that need consistent hover, focus, and active states. The picker gives them a base hue, then they adjust saturation and lightness by fixed steps for each state.

    Freelancers and small business owners work across many platforms. One day they style a WordPress blog, the next day a Shopify store, a Mailchimp newsletter, or a Canva graphic. A free picker helps match button colors, headings, and backgrounds to a logo without buying extra software. According to HubSpot, consistent branding across channels can increase revenue, so keeping colors aligned is not just cosmetic.

    To keep their work organized, many of these users combine several Tools Repository utilities:

    • Grab a color with the Color Picker.

    • Check readability with the Color Contrast Checker.

    • Save a set of brand colors with the Color Palette Generator.

    Students, bloggers, and content writers use color pickers in lighter ways but still often. A writer formatting a post in Notion or Google Docs might match heading colors to a chart exported from Google Sheets. A design student can study how famous brands use hue and contrast by sampling screenshots. Tools Repository supports these groups with its color utilities plus general helpers like JSON viewers and code formatters, all inside one minimal interface.

    The Bottom Line: Instant Color Extraction Without The Complexity

    Hands holding glowing color sphere representing instant color extraction

    The Bottom Line section sums up why an online color picker tool feels so helpful in daily work. It gives you instant color codes without installing software, creating accounts, or dealing with complicated menus. You click, copy, and paste, and your interfaces, slides, and graphics stay consistent.

    Because tools like those on Tools Repository run fully in the browser with client-side code, your images and screenshots stay private. You also get related helpers such as the Color Contrast Checker and Color Palette Generator in the same place. That mix turns color picking from a slow side task into a quick, reliable habit.

    Conclusion

    An online color picker tool pulls most of the technical work out of color choices, so you can focus on layout, copy, or product logic. By supporting HEX, RGB, and HSL in one quick step, it bridges the gap between design and code. Privacy-friendly, zero-cost tools such as Tools Repository make this power available to anyone with a browser. Once you add a picker to your bookmark bar, matching colors across every project starts to feel simple and repeatable.

    Frequently Asked Questions

    Question 1: How Do I Pick A Color From A PDF Or External Website?

    You pick a color from a PDF or site by using the browser EyeDropper API inside the online color picker tool. Open the PDF or page beside the tool window, then click the “Pick color” button (for example, on the Tools Repository color picker). Move the cursor over the PDF or site, click the target pixel, and copy the codes shown.

    Question 2: Is An Online Color Picker Tool Safe To Use With Confidential Files?

    An online color picker tool that uses client-side processing is safe for confidential files. The image or screenshot stays inside your browser memory and is not sent to a server. Tools Repository follows this model, so internal dashboards, brand guides, and unreleased layouts remain on your device.

    Question 3: What Is The Difference Between HSL And HSV In A Color Picker?

    HSL and HSV both describe color with hue and saturation, but they treat brightness differently:

    • HSL uses Lightness, which mixes white and black into the color.

    • HSV uses Value, which changes how strong the base hue appears.

    Designers usually prefer HSL for interface themes, while painters and 3D artists often pick HSV because it feels closer to mixing light.

    Question 4: Do I Need To Create An Account To Use A Free Color Picker?

    You do not need an account for a free, browser-based online color picker tool such as those on Tools Repository. You open the page, use the picker, and leave without any login, subscription, or credit card screen. This keeps the workflow fast for quick, everyday color tasks.

  • How to Calculate Discount Percentage (Easy Guide)

    How to Calculate Discount Percentage (Easy Guide)

    Introduction

    Sale tags can be confusing when you try to work out what you actually pay. If you know how to calculate discount percentage, that stress turns into a short, clear process. Instead of guessing, you see exactly how much the price drops.

    A discount percentage is a share of the original price out of one hundred. Once you see it that way, a label like 25% off or 40% off is much easier to read. This guide walks through the core formula, simple examples, and common reverse questions.

    You will also see how to find your savings, compare deals, and avoid manual mistakes with Tools Repository. Ready to make sale math simple and fast? Keep reading for the three easy steps.

    Key Takeaways

    • You rely on one simple percent idea that links the part and the whole. Once you see that pattern, discount numbers feel less scary.

    • You can follow a clear three step path for any sale: turn the percent into a decimal, find the discount amount, then subtract.

    • You can see both your savings in dollars and the final price, which makes it easier to compare offers and write clear sale copy.

    • You can work backward when you know both prices. A short reverse formula gives you the missing discount percentage.

    • You can skip hand math with Tools Repository’s Discount Calculator, which runs in your browser and gives instant numbers while keeping data on your own device.

    What Is a Discount Percentage and Why Does It Matter?

    Shopper comparing discount deals on smartphone in retail store

    A discount percentage is a price cut written as a fraction of the original price per one hundred parts. It tells you how large the reduction is compared with the full price. Instead of a flat dollar amount, it scales with the item cost.

    According to Khan Academy, the word percent means per hundred, so 20 percent is 20 out of 100 equal parts of the whole. In a sale, that means 20 parts out of every 100 parts of the original price disappear. A 20 percent discount on 50 dollars and on 500 dollars uses the same rule, but the saved money changes with the base price.

    A fixed amount discount removes the same dollar value every time. Ten dollars off always means you save ten dollars. A 10 percent discount, by contrast, saves 5 dollars on a 50 dollar item and 50 dollars on a 500 dollar item. That is why many online stores such as Amazon and Walmart often use percentages for wide price ranges.

    Once you know how to calculate discount percentage, you gain control in many roles:

    • As a shopper, you can see whether “30 percent off” really beats “40 dollars off”.

    • As a freelancer, you can add clear early payment discounts to invoices.

    • As a web developer or UI designer, you can build accurate price labels for a cart.

    • As a student, you meet this topic on exams such as ACT WorkKeys Applied Math from ACT.

    “A discount is a reduction from a listed price that sellers use to increase sales volume.”
    — Summary of guidance from Investopedia, Financial Education Resource

    The Core Formula for How to Calculate Discount Percentage

    Notepad and calculator showing discount formula calculation steps

    The core formula for how to calculate discount percentage uses standard percent math. You compare a part to a whole, then scale it by one hundred. For discounts, the whole is the original price and the part is either the discount amount or the amount you pay.

    According to Investopedia, the basic percent formula is (Part / Whole) × 100. To find the final price after a discount, you have two handy options. The first finds the discount in dollars, then subtracts it. The second jumps straight to the part of the price that remains.

    With the subtraction method, you use
    Price after discount = Original Price − (Original Price × Discount% / 100)

    If a shirt costs 80 dollars with a 25 percent discount, first find the discount amount:
    80 × 25 / 100 = 20

    Then subtract: 80 − 20 = 60 dollars as the sale price.

    With the remainder method, you focus on the part you still pay. If 25 percent comes off, you pay 75 percent of the original price. The formula looks like
    Price after discount = Original Price × (1 − Discount% / 100)

    In the same shirt example, that is
    80 × (1 − 0.25) = 80 × 0.75 = 60 dollars.

    Both paths lead to the same result, so you can choose the one that feels faster.

    You can also work backward from prices you already know. When original and sale prices are both known, the discount percentage comes from

    Discount% = 100 × ((Original Price − Discounted Price) / Original Price)

    If a software license drops from 120 dollars to 90 dollars, the savings are 30 dollars. The ratio 30 / 120 equals 0.25, and 0.25 × 100 gives a 25 percent discount.

    Quick Reference Table

    GoalFormula
    Final price after discountOriginal Price × (1 − Discount% / 100)
    Savings amountOriginal Price × (Discount% / 100)
    Discount percentage100 × (Savings / Original Price)
    Original price from sale priceDiscounted Price / (1 − Discount% / 100)

    How to Calculate Discount Percentage in 3 Easy Steps

    To apply any discount, you can follow a three step pattern. This pattern works for clothes, SaaS plans, freelance projects, and more. It is a direct way to turn a banner like “25 percent off” into real dollars.

    Let us walk through an 80 dollar jacket at 25 percent off.

    1. Step 1 – Turn the Percent Into a Decimal
      The label says 25 percent, which means 25 per hundred. Divide 25 by 100 to get 0.25. That decimal form is easier to use in a calculator or in code. Many math sites such as Khan Academy teach this as the first step for almost any percent problem.

    2. Step 2 – Find the Discount Amount
      Multiply the original price by the decimal. In this case, 80 × 0.25 = 20. That 20 is the dollar amount of the discount, so you already know how much you save.

    3. Step 3 – Subtract to Get the Final Price
      Take the original price and subtract the discount amount. Compute 80 − 20, which gives 60 dollars. That 60 dollars is the price you pay at the register or in the cart. You can now show it cleanly in your UI or your invoice.

    Here is another example that uses the remainder method on a higher price. Suppose a camera costs 250 dollars, and a sale offers 30 percent off. You still turn 30 percent into 0.30, but you now look at the part you keep, which is 70 percent or 0.70. When you multiply 250 × 0.70, you get 175 dollars as the sale price. If you instead follow the three step path, you find a 75 dollar discount in step 2 and reach the same 175 dollars in step 3.

    According to the sample items for ACT WorkKeys Applied Math from ACT, multi step percent problems like these appear often in workplace style questions. So this small three step habit helps with both daily shopping and career tests.

    A quick tip helps you move faster: when you only care about savings, you can stop right after step 2. The number from Original Price × Decimal Discount is exactly how much money stays in your pocket.

    What If You Only Know the Before and After Prices?

    Colorful retail price tags scattered representing discount shopping

    When you know the original price and the sale price, you can still find the missing discount rate. You do this by comparing the savings to the original price, then scaling that ratio by one hundred.

    The formula looks like this:
    Discount% = 100 × ((Original Price − Discounted Price) / Original Price)

    Try a simple case. A design tool drops from 120 dollars to 90 dollars. The savings are 120 − 90 = 30 dollars. Divide 30 by the original 120 to get 0.25. Multiply by 100, and you have a 25 percent discount. This reverse method is handy for dynamic “You save X percent” badges in a React cart, checking promo claims in copy, or working through textbook problems.

    Research on promotion clarity from Shopify notes that clear savings labels help shoppers compare offers faster. Knowing this reverse formula lets you generate those labels with confidence.

    How Tools Repository’s Free Discount Calculator Simplifies the Process

    Professional using online discount calculator tool on laptop

    Manual steps teach you the idea, but repeated discount math can still take time. Tools Repository solves that problem with a free Discount Calculator that runs right in your browser. You enter the original price and the discount rate, and the tool shows the final price and the savings amount at once.

    Everything on Tools Repository works in a privacy friendly way. The Discount Calculator, Percentage Calculator, and Sales Tax Calculator all run on the client side. That means your numbers never leave your device, and no sign up or tracking script appears. For freelance developers and small teams, this feels like having a tiny helper script without writing it yourself.

    “Clear price comparisons and visible savings reduce effort for users and help them decide faster.”
    — Summary of research from Nielsen Norman Group, UX Research Firm

    Here is how the Discount Calculator helps in daily work:

    • It gives instant results as you type in the price and percent. There is no heavy form to submit, and no page reload. If you change the rate from 15 percent to 18 percent, the final price updates right away, which is great when you test several offer ideas in a row.

    • It respects privacy by keeping all math inside your browser. Tools Repository does not send your prices to a server or attach an analytics profile. That matters when you plug in client invoices or sensitive internal rates. You get accurate numbers without giving up data.

    • It stays free, fast, and responsive on any screen. You can open it on a phone at a store, on a tablet in class, or on a desktop while you code. The same simple layout supports the Discount Calculator, the general Percentage Calculator, and other helpers on Tools Repository.

    According to Statista, many shoppers look for deals before they buy, so clear and accurate discount math can raise trust. Tools Repository gives students, copywriters, and developers a quick way to check that math without extra accounts or installs.

    Conclusion

    Hands holding smartphone using mobile discount calculation tool

    You now know how to calculate discount percentage with one clear set of ideas. You turn the percent into a decimal, find the discount amount, and subtract to get the sale price. The same formulas let you work backward to the missing discount rate or original price.

    These steps help with store purchases, school exams, pricing pages, and freelance invoices. Whenever you want extra speed or want to avoid manual mistakes, Tools Repository is ready to help. Its free Discount Calculator and Percentage Calculator give instant, private results inside your browser. Open Tools Repository in a tab, try a few real prices, and see how much smoother your next sale or project feels.

    Frequently Asked Questions

    Many people have small but important questions about discount math. These quick answers cover the ones that show up most often in class, in stores, and in pricing tools.

    Question 1: What Is the Easiest Way to Calculate a Discount Percentage Mentally?
    The easiest mental trick uses common fractions. Remember that 50 percent is one half, 25 percent is one quarter, and 10 percent is one tenth. For example, 25 percent off 80 dollars means you split 80 into four parts. Each part is 20 dollars, so you pay 60 dollars.

    Question 2: How Do I Calculate the Original Price If I Only Know the Sale Price and Discount Percentage?
    Divide the sale price by the part that remains after the discount. The formula is Original Price = Discounted Price / (1 − Discount% / 100). If a monitor costs 150 dollars after 40 percent off, the remaining part is 0.60. Compute 150 ÷ 0.60 to get a 250 dollar original price.

    Question 3: Is a 20% Discount Always Better Than $15 Off?
    No, you must compare them on the actual price. On a 100 dollar item, 20 percent off saves 20 dollars, which beats 15 dollars off. On a 50 dollar item, 20 percent off saves only 10 dollars, so a flat 15 dollar discount is stronger. Always compute both savings before you choose.

    Question 4: What Is a Compound or Stackable Discount, and How Is It Calculated?
    A compound discount applies two or more percentages one after another on the changing price. You never add the percents. For a 200 dollar item with 20 percent off then 10 percent off, first drop the price to 160 dollars. Then take 10 percent off 160 to reach 144 dollars, which is a total effective discount of 28 percent.

    Question 5: Can I Use Tools Repository’s Discount Calculator Without Creating an Account?
    Yes, you can use Tools Repository without any account at all. The Discount Calculator is free, runs only in your browser, and does not store your input. You just open the page, type the price and discount percentage, and read the final price and savings on screen.

  • How to Calculate Percentage Change Easily

    How to Calculate Percentage Change Easily

    Introduction

    Knowing how to calculate percentage change quickly matters for grades, pricing, dashboards, and performance reports. It shows how much a value moves from an old number to a new one as a percent.

    The idea sounds simple, but negative numbers, mixed units, and rushed mental math often cause mistakes. One tiny sign error can flip an increase into a decrease.

    Percentage change uses a clear formula that compares the difference between values to the original value, then scales it by 100. In this guide, you will see the exact formula, a step‑by‑step process, comparison tables, worked examples, and a faster way to skip manual math using Tools Repository.

    Ready to make percent changes feel automatic instead of confusing? Keep reading for clear rules and easy patterns you can reuse anywhere.

    Key Takeaways

    Percentage change tells you how much a value moves relative to the starting value, not just the raw difference. It turns that shift into a percent so you can compare growth or drop across very different numbers.

    • The percentage change formula uses one simple pattern: subtract the old value from the new value, divide by the absolute starting value, and then multiply by 100. This single structure works in finance, science, and everyday comparisons.

    • The absolute value in the denominator matters a lot. It removes any negative sign from the starting number. That keeps the final sign correct so increases stay positive and decreases stay negative, even when the starting value is below zero.

    • Positive results mean an increase, while negative results signal a decrease. The sign comes from the numerator after subtraction. When the final value is bigger than the initial value, the result is positive. When the final value is smaller, the result has to be negative.

    • Common mistakes include swapping old and new values, skipping the absolute value, and rounding too early. Each of these errors can flip the sign or distort the size of the change. Slowing down for the formula steps removes most of these headaches.

    • Tools Repository offers a free Percentage Calculator that does this math instantly. You type the two numbers, and the result updates in real time. There is no login, no tracking, and it works in any modern browser on desktop or mobile.

    What Is Percentage Change and How Is It Different From Similar Metrics?

    Colorful comparison chart showing different percentage metrics on desk

    Percentage change measures how much a value grows or shrinks relative to its initial value, not just the raw difference. It reports this shift as a percentage, with a positive sign for an increase and a negative sign for a decrease.

    In practice, percentage change asks one key question: How big is the move from the starting value compared with that starting value itself? If you go from 50 to 75, the move is not just 25 units. It is a 50 percent increase because 25 is half of 50.

    This idea shows up in many places. The U.S. Bureau of Labor Statistics reports inflation as percent in the Consumer Price Index, not just point moves, so people can compare periods fairly (Bureau of Labor Statistics). The World Bank tracks population growth the same way, often around 1 percent growth per year in recent decades (World Bank). Sites like Investopedia and Morningstar also report stock returns as percent changes to keep results comparable across companies.

    Several related metrics often get mixed up with percentage change. To avoid that confusion, it helps to compare them side by side. Many tutorials from Khan Academy and Coursera stress this distinction early because it affects how you interpret graphs, dashboards, and reports.

    Here is a compact comparison.

    MetricReference PointDirectional?Always Positive?
    Percentage ChangeInitial value✅ Yes❌ No
    Percentage DifferenceAverage of both values❌ No✅ Yes
    Percentage PointsDirect difference between two percentages❌ No❌ No

    Percentage difference cares only about how far apart two numbers are, not which came first. For example, comparing two server response times with no clear “before” and “after” uses percentage difference.

    Percentage points, used a lot by the European Central Bank and the Federal Reserve, simply subtract one rate from another. Moving a loan rate from 3 percent to 4 percent is a 1 percentage point change, but about a 33.3 percent increase.

    Keeping these terms straight makes graphs in tools like Google Sheets, Microsoft Excel, and analytics dashboards much easier to read and explain.

    “Without data, you’re just another person with an opinion.” — W. Edwards Deming

    Understanding percentage change, percentage difference, and percentage points gives that data context, so your charts and reports tell a clear story.

    The Percentage Change Formula Explained

    Person writing percentage change calculations on notepad at desk

    The percentage change formula describes how to calculate percentage change using a single, repeatable pattern. It compares the difference between final and initial values to the initial value, then converts that ratio to a percent.

    Written in words, the formula is:

    Percentage Change = [(Final Value − Initial Value) / |Initial Value|] × 100

    Using symbols, where V₁ is the initial value and V₂ is the final value:

    % Change = [(V₂ − V₁) / |V₁|] × 100

    • The numerator, V₂ − V₁, captures the raw change. If V₂ is larger, this part is positive. If V₂ is smaller, this part is negative. That sign tells you if the value increased or decreased.

    • The denominator, |V₁|, is the absolute value of the starting number. The absolute value is simply the distance from zero, so |−25| equals 25. This step removes any negative sign from the starting value before you divide.

    • Multiplying by 100 converts the decimal ratio into a percentage. For example, a ratio of 0.2 becomes 20 percent. Sites like Wolfram Alpha and Desmos apply this same formula behind the scenes when you ask for percent changes.

    According to the National Center for Education Statistics, only about one‑third of eighth‑grade students reach a proficient level in math problem solving (National Center for Education Statistics). A clear grip on this formula helps students and professionals avoid common sign mistakes, especially when negative numbers enter the picture.

    Why the Absolute Value Rule Cannot Be Ignored

    Student studying percentage change formula with notebook and calculator

    The absolute value in the denominator is not a small detail. It guards the sign so the result matches reality.

    Take the change from −10 to −25. The correct setup is:

    [(−25 − (−10)) / |−10|] × 100
    = (−15 / 10) × 100
    = −150%

    This tells you the final value is a 150 percent decrease from the starting value. If you forget the absolute value and divide by −10 instead, you get +150 percent, which would claim a huge increase even though the number dropped.

    The same rule appears in many university notes from MIT and Stanford, because this sign flip is one of the most frequent errors on exams. Remember this key idea: whenever the final value is numerically smaller than the initial value, the percentage change must be negative. If your result is positive in that case, something is wrong.

    For quick checking, keep these mini‑rules in mind:

    • Final value bigger than initial value → percentage change should be positive.

    • Final value smaller than initial value → percentage change should be negative.

    • Final value equal to initial value → percentage change is exactly zero.

    How to Calculate Percentage Change: Step-By-Step With Examples

    Financial analyst reviewing percentage change trends in printed report

    Learning how to calculate percentage change by hand follows the same short sequence every time. Once you know the pattern, you can apply it to prices, scores, response times, or even design metrics in Figma or Adobe XD.

    Here is the six‑step process.

    1. Identify the initial value (V₁) and the final value (V₂). Decide which number came first in time or logic. The starting value is always V₁, and the later value is V₂.

    2. Subtract the initial value from the final value. Compute V₂ − V₁ to find the raw change. A positive result here shows the value went up. A negative result shows it went down.

    3. Take the absolute value of the initial value. Replace V₁ with its distance from zero, written as |V₁|. This removes any negative sign from the starting value so the denominator is always non‑negative.

    4. Divide the difference by the absolute initial value. Take the result from step 2 and divide it by |V₁|. This gives a decimal that shows the change as a share of the starting value.

    5. Multiply by 100. Turn the decimal into a percentage by multiplying by 100. You can round to a sensible number of decimal places, such as one or two, depending on context.

    6. Interpret the sign. A positive percentage change means an increase from V₁ to V₂. A negative percentage change means a decrease. Zero means no change at all.

    Now let us plug this into concrete examples that match real‑life data sets you might see from the U.S. Census Bureau, Stripe, or Google Analytics.

    ScenarioV₁V₂Result
    Standard increase6072+20%
    Fractional decrease3.502.625−25%
    Positive to negative50−22−144%
    Negative to positive−2525+200%

    Walk through one of them in detail. For 60 to 72:

    • Difference = 72 − 60 = 12

    • Denominator = |60| = 60

    • Ratio = 12 / 60 = 0.2

    • Percentage change = 0.2 × 100 = 20%

    So the final value is a 20 percent increase from the starting value.

    For 50 to −22:

    • Difference = −22 − 50 = −72

    • Denominator = |50| = 50

    • Ratio = −72 / 50 = −1.44

    • Percentage change = −1.44 × 100 = −144%

    That shows a 144 percent decrease. The value dropped more than the entire starting amount, which is common in markets tracked by Yahoo Finance or Bloomberg.

    Here is a quick reference set you can keep in your head:

    • When a value moves from 5 to 20, the change is a 300 percent increase. The difference is 15, and 15 is three times the starting value.

    • When a value moves from 20 to 10, the change is a 50 percent decrease. The difference is −10, and −10 is half of the starting value.

    • When a value moves from 2 to 3, the change is a 50 percent increase. The difference is 1, and that is half of the starting value.

    • When a value moves from 5 to 4, the change is a 20 percent decrease. The difference is −1, and that is one fifth of the starting value.

    This same pattern works for decimals and for time values. For example, if a page load time in Chrome improves from 2:30 to 1:45, you can convert both to seconds, use the formula, and then convert back. Tools Repository’s Percentage Calculator accepts decimal values directly, so you often do not need to convert by hand.

    According to the World Bank, many countries saw annual population growth below 2 percent in recent years (World Bank). These small values still matter a lot over decades, which is why being precise with percentage change is so important in economics and science.

    “If you can’t explain something in simple terms, you don’t really understand it.” — often attributed to Richard Feynman

    Walking through examples like these is one of the fastest ways to build real comfort with percentage change.

    How Tools Repository’s Percentage Calculator Makes This Instant

    Modern workspace with laptop showing percentage calculator dashboard

    Tools Repository’s Percentage Calculator turns the steps for how to calculate percentage change into a quick, reliable interaction. Instead of working through each part on paper, you type two numbers and watch the answer appear as you type.

    The tool runs entirely in your browser, using high‑precision math libraries similar to those in scientific tools like MATLAB and NumPy. That means you get accurate results even on messy decimal inputs. There is no login wall, no account, and no data sent to a server, which lines up with privacy expectations many people now have after reading reports from Mozilla and the Electronic Frontier Foundation.

    Here is how it helps in daily work:

    • Instant, real‑time results remove the need for spreadsheets. As you change V₁ and V₂, the percentage change updates at once, so you can test several scenarios for prices, grades, or KPI targets.

    • High numeric precision supports finance and analytics tasks. Whether you are checking a return from a Robinhood export or a conversion rate from Google Analytics, the calculator keeps rounding under control.

    • A privacy‑first design keeps your data local. All work happens client side, similar to how VS Code runs extensions on your machine. Tools Repository does not track, log, or store your inputs.

    • Full browser support makes it easy to use on any device. You can open it in Safari on an iPhone, Chrome on Android, or desktop browsers while working in Notion or Trello.

    Tools Repository also offers related free calculators, such as a Sales Tax Calculator, Discount Calculator, Compound Interest Calculator, Savings Goal Calculator, and Tip Calculator. Together, they cover many daily tasks for freelancers, small business owners, students, and developers who need clear percentages without installing anything. Try the Percentage Calculator on Tools Repository when manual math would slow you down in the middle of coding, writing, or design work.

    “Perfection is achieved, not when there is nothing more to add, but when there is nothing left to take away.” — Antoine de Saint‑Exupéry

    A small, focused tool like Tools Repository’s Percentage Calculator follows that idea: just the inputs you need, the formula you expect, and an answer you can trust.

    According to Pew Research Center, about 85 percent of adults in the United States own a smartphone (Pew Research Center). Browser‑based tools like Tools Repository fit neatly into that habit, because they run anywhere a modern browser does.

    Loppkokkuvõte (Conclusion)

    Calculate Smarter, Not Harder

    The core formula for percentage change is simple: [(V₂ − V₁) / |V₁|] × 100. The subtraction shows the direction of the move, and the absolute value keeps the sign honest when negative numbers are involved.

    Once you follow the six clear steps, most common errors disappear, even in tricky cases like going from −25 to 25 or 50 to −22. You can then read percent changes in reports from the Bureau of Labor Statistics, World Bank, or your own dashboards with confidence.

    Whenever a deadline is tight or the numbers are messy, Tools Repository’s free Percentage Calculator is there for fast, private, accurate results. Open it in your browser, enter the two values, and move on with your project.

    Frequently Asked Questions

    What Is the Formula for Percentage Change?

    The formula for percentage change is:

    (Final Value − Initial Value) / |Initial Value| × 100

    Here, the initial value (V₁) is the starting number, and the final value (V₂) is the later number you compare it to. You take the absolute value of the initial value in the denominator so the sign of the result correctly reflects an increase or a decrease.

    What Is the Difference Between Percentage Change and Percentage Difference?

    Percentage change compares an initial value and a final value in a clear order, and the result can be positive or negative.

    Percentage difference compares two values without picking a starting one, uses their average as the reference, and is always positive. For example, comparing two product prices without a “before” and “after” uses percentage difference instead of percentage change.

    How Do You Calculate Percentage Change With Negative Numbers?

    You calculate percentage change with negative numbers using the exact same formula. For example, going from −10 to −25 gives:

    [(−25 − (−10)) / |−10|] × 100 = −150 percent.

    The absolute value in the denominator is the key step. If you divide by −10 instead of 10, the sign flips and you wrongly get +150 percent. If the final value is smaller, the result must be negative.

    Can I Calculate Percentage Change for Time Values or Decimals?

    Yes, you can use the percentage change formula for decimals and time values:

    • For times like 2:30 and 1:45, convert both to seconds, apply the formula, then convert back if needed.

    • Decimal numbers work directly without conversion.

    Tools Repository’s Percentage Calculator accepts decimal inputs and handles the math for you, so you do not need to convert formats manually.

    What Does a Percentage Change of More Than 100% Mean?

    A percentage change greater than 100 percent means the value grew by more than its whole starting size. For instance, moving from −25 to 25 is a +200 percent change, because the shift of 50 is twice the absolute starting value of 25. Values above 100 percent are common in investment returns, population growth studies, and scientific measurements that track very fast changes.

  • How to Calculate Body Fat Percentage at Home

    How to Calculate Body Fat Percentage at Home

    Introduction

    Scale weight alone can fool me, since it ignores how much of my body is fat versus muscle. Learning how to calculate body fat percentage gives a much sharper view of health, performance, and long‑term risk. In this guide I walk through simple math‑based methods and when it makes sense to look at clinical tests.

    First I lay out what body fat percentage actually measures and how it compares to BMI. Then I show step‑by‑step tape‑measure math using the US Navy method, plus fast BMI‑based formulas when I only know height and weight. I also explain pro‑level tools like DEXA scans and smart scales.

    By the end, I can read my own numbers with context and use Tools Repository to run the math in private, as often as I like.

    Key Takeaways

    • Body fat percentage compares how much of my total weight is fat versus lean tissue, so it tells me more about health than the scale alone. Two people can weigh the same but have very different fat levels and risk patterns, which is why focusing only on pounds often hides real changes.

    • The US Navy tape method is the best at‑home way I can use with only a soft tape and a calculator. It uses neck, waist, and hips for women, and neck and waist for men, to estimate fat in a repeatable way. With careful measuring, it comes close to clinical tools.

    • BMI‑based body fat formulas are handy when I only know height, weight, age, and sex. They are quick to apply in code or a spreadsheet and match broad population patterns. They still struggle with athletes and older adults, so they work best as a backup.

    • Clinical methods such as DEXA, hydrostatic weighing, and the BOD POD measure body fat with higher accuracy. These options cost more money and time and are usually found in hospitals, research labs, or advanced sports centers. For most people they make sense only a few times, not every month.

    • Tools Repository gives me a free body fat percentage calculator that runs fully in the browser with no login. I can plug in tape and weight data and see instant numbers plus related metrics like BMI and ideal weight. My health data stays on my device instead of on someone else’s server.

    What Is Body Fat Percentage and Why Does It Matter?

    Two people with different body compositions standing in gym

    Body fat percentage tells me what share of my total body weight comes from adipose tissue instead of lean mass. Lean mass includes muscle, bone, organs, and water, so this single number captures the balance between stored energy and working tissue. Two people can both weigh 180 pounds, but if one carries 15 percent body fat and the other 30 percent, their health picture is very different.

    According to the American Council on Exercise, body fat ranges fall into several broad groups:

    • Essential fat: about 2–5 percent for men and 10–13 percent for women. This is the bare minimum for hormone and organ function.

    • Athletes: roughly 6–13 percent for men and 14–20 percent for women.

    • Fitness and average: progressively higher ranges that still cover many healthy people.

    • Obese: above 25 percent for men and 32 percent for women on the ACE chart.

    Age also changes the picture. Jackson and Pollock charts show that a healthy 20‑year‑old man might sit near 8.5 percent body fat, while a 55‑year‑old man with the same health status is closer to 20.9 percent. The same pattern holds for women, so I try to compare my number with people my age, not college athletes. Research reviewed in the New England Journal of Medicine and The Lancet links rising body fat, especially around the waist, with higher rates of early death across millions of adults.

    In short, body fat percentage lets me go beyond a simple BMI label. I can see whether added weight comes mostly from muscle or from fat and how far I sit from ranges linked with better health. That context matters when I set training goals or talk with a doctor about risk.

    How to Calculate Body Fat Percentage Using the US Navy Method

    Soft tape measure and fitness tools laid out on white surface

    The US Navy method gives me a clear way to calculate body fat percentage at home using only a tape measure. It was developed at the Naval Health Research Center and is still used widely because it balances convenience and accuracy. The method estimates body fat from the relationship between height and a few body circumferences.

    For measurements:

    • Men

      • Measure height while standing tall without shoes.

      • Wrap the tape around the neck just below the Adam’s apple, keeping the tape slightly slanted downward at the front.

      • Measure waist horizontally at the level of the navel while standing relaxed and breathing normally.

    • Women

      • Take the same height, neck, and waist measurements as men.

      • Add a hip measurement at the widest point across the buttocks.

    According to research from the Naval Health Research Center, measurements should be taken to the nearest quarter inch or half centimeter for best accuracy.

    Tip: Take at least two readings for each measurement and use the average. Measuring at the same time of day, before a meal, helps keep results more consistent.

    Here is the basic idea of the math without drowning in symbols. The formulas for both sexes use base‑10 logarithms of these measurements to model how body volume and shape relate to fat. After I plug in my numbers, I get a body fat percentage that is often within a few points of lab methods. For example, a man who is 70 inches tall with a 16‑inch neck and 34‑inch waist will usually calculate around the mid‑teens.

    Once I know my percentage, I can find fat mass and lean mass:

    • Fat mass = (body fat percentage ÷ 100) × total body weight

    • Lean mass = total body weight − fat mass

    That split helps me track whether changes on the scale come more from fat loss or muscle change instead of guessing.

    Simplify The Calculation With Tools Repository’s Body Fat Percentage Calculator

    Person using a health calculator on smartphone at home

    Instead of writing formulas by hand, I can let Tools Repository handle the math for me. The Body Fat Percentage Calculator on Tools Repository uses the same US Navy method I just walked through, with a clear form for height, neck, waist, and hips where needed. I type in my numbers and see my estimated body fat in less than a second.

    All of these calculations run in my browser, so my measurements never leave my device. According to Tools Repository’s own docs, there is no tracking code, no cookies for profiling, and no account system at all. The calculator also works smoothly on phones, tablets, and desktops and sits next to other helpful tools like the BMI Calculator, Ideal Weight Calculator, Macros Calculator, BSA Calculator, and Weight Converter. That makes it easy for me to compare several health metrics side by side without juggling apps or sign‑ups.

    Can You Estimate Body Fat Using BMI? The Formula Based Approach

    I can also learn how to calculate body fat percentage from BMI when I only know height, weight, age, and sex. BMI itself is just a height‑ and weight‑based index:

    • Metric: BMI = weight (kg) ÷ [height (m)]²

    • Imperial: BMI = weight (lb) × 703 ÷ [height (in)]²

    On its own, BMI can mislabel muscular people as overweight, but it works well in large studies.

    Researchers then created formulas that turn BMI into an estimated body fat percentage by adding age and sex. For adults, a common set of equations is:

    • Men: body fat (%) = 1.20 × BMI + 0.23 × age − 16.2

    • Women: body fat (%) = 1.20 × BMI + 0.23 × age − 5.4

    Versions for boys and girls under 18 use different constants so they match childhood growth patterns better, as described in work cited by the World Health Organization.

    These formulas are handy for quick checks or large databases, and they are easy for me to code into a web app. Yet they still share BMI’s weak spots. They cannot see whether extra weight is dense muscle or stored fat, and they do not know where fat sits on the body. Studies reviewed by the Centers for Disease Control and Prevention show that people of Asian, Black, or Middle Eastern background often reach higher health risk at different BMI levels than white peers.

    Tip: If I lift heavy weights or have lost a lot of muscle with age, I treat BMI‑based body fat results as a rough screening tool, not a final answer.

    So when I care about my own body rather than a population chart, I rely more on tape‑based or clinical methods. BMI‑based body fat estimates make sense when I am building quick tools, screening many people at once, or filling gaps when I do not have a tape handy. I just remember to treat the results as rough, not as precise numbers.

    What Are the Most Accurate Clinical Methods for Measuring Body Fat?

    Clinical DEXA scan machine in a medical imaging room

    Clinical methods to calculate body fat percentage give me the tightest error bars but also cost more money and time. They use physics or imaging instead of tape and home math. Picking the right one depends on whether I just want a snapshot or need detailed data for medical or sports reasons.

    Common clinical options include:

    • Skinfold calipers
      A trained professional pinches fat folds at several spots, such as the triceps, abdomen, and thigh, and reads the thickness in millimeters. Those numbers go into standard tables or software that estimate body fat. Accuracy can be good when the tester has strong experience, but it drops a lot for very lean athletes or people with severe obesity.

    • Bioelectrical impedance analysis (BIA)
      This method powers most smart scales and handheld devices. It sends a tiny electrical current through the body and measures how much it slows down. Because muscle holds more water than fat, the device can infer relative amounts of each. According to the National Institutes of Health, readings can swing widely with changes in hydration, illness, or heavy exercise, so it helps to test under the same conditions each time. These devices also are not suitable for people with pacemakers.

    • DEXA scans
      Among imaging tools, DEXA stands out for its balance of detail and access. A short, low‑dose X‑ray scan splits the body into bone, lean tissue, and fat, often broken down by arms, legs, and torso. Private clinics in the United States often charge around 100 to 200 dollars per scan, as reported by the American Journal of Roentgenology.

    • Hydrostatic weighing and BOD POD
      These methods focus on body density, using water or air displacement. They show very high accuracy in lab settings but require special equipment that most people never see outside research or elite sports facilities.

    Tip: If I book a DEXA, hydrostatic, or BOD POD test, I keep copies of the full report. Comparing a new scan against the same method years later shows long‑term changes very clearly.

    For nearly everyone, these methods are interesting reference points rather than regular tracking tools. Tape measures and calculators are usually enough for month‑to‑month progress.

    Making the Most of Your Body Fat Percentage Results

    Fit person reviewing body composition progress chart in home gym

    Using these methods to calculate body fat percentage is only helpful if I know what to do afterward. I start by comparing my number with ACE categories and age‑adjusted Jackson and Pollock targets instead of fixating on a single ideal. That way I see a band of values that fit my age, sex, and activity level.

    Next, I look at trends more than single readings. A two‑point shift over a few months means more than one reading that seems a bit off. Here is the key part: if my number sits far into the obese range or drops below essential fat, I treat that as a prompt to speak with a doctor or registered dietitian, not as a reason for panic.

    From there, I can:

    • Adjust calorie intake and macronutrients so they line up with my goals.

    • Review my training plan to include both resistance work and cardio.

    • Set a realistic time frame for change instead of chasing overnight results.

    Reminder: Body fat percentage is information, not a verdict. I use it to guide better choices, not to judge myself.

    Conclusion

    Body fat percentage gives me a clearer health signal than the scale because it separates fat from everything else that makes up my weight. I can use the US Navy tape method, BMI‑based formulas, smart scales, or clinical scans depending on my needs and budget. Tape methods and the Body Fat Percentage Calculator from Tools Repository are usually plenty for regular tracking and quiet goal setting at home.

    Since Tools Repository runs fully in the browser and keeps measurements off remote servers, it fits well with a privacy‑first approach to health data. I can also jump between its BMI, ideal weight, and macros tools when I want extra context for training or nutrition plans. Whatever numbers I see, I remember that they are information, not judgment, and I pair them with professional advice when I plan big changes.

    Frequently Asked Questions

    What Measurements Do I Need To Calculate Body Fat Percentage at Home?

    To calculate body fat percentage at home with the US Navy method, men need neck, waist, and height measurements. Women need neck, waist, hip, and height measurements. All values should come from a soft tape held level around the body while standing relaxed. I write them down to the nearest quarter inch or half centimeter. Tools Repository’s calculator accepts these measurements directly and performs the full Navy math instantly in my browser.

    How Accurate Is the US Navy Method Compared To a DEXA Scan?

    The US Navy method is reasonably accurate for most people, often landing within about three to four percentage points of lab methods. It works best when I measure carefully and use the same tape spots each time. A DEXA scan from a medical imaging center gives a more precise split of bone, lean tissue, and fat, often used in research or clinical care. For everyday tracking and fitness goals, the Navy method and Tools Repository’s calculator are usually more than enough.

    Is It Safe To Have Very Low Body Fat Percentage?

    Very low body fat can be unsafe once it dips below essential levels needed for normal function. ACE lists essential fat at about 2–5 percent for men and 10–13 percent for women, which supports hormones, nerves, and organs. The athlete range sits just above that and is safer for most active people. Going lower can harm heart health, mood, fertility, and bone density, so I only aim that low with close medical supervision.

    Does Body Fat Percentage Change With Age?

    Yes, body fat percentage almost always rises with age, even if weight stays similar. Metabolism slows and hormones shift, which makes it easier to gain fat and harder to keep muscle. Jackson and Pollock charts show that a healthy 20‑year‑old man averages around 8.5 percent body fat, while a healthy 55‑year‑old man averages near 20.9 percent. Using these age‑adjusted targets helps me set realistic, sustainable goals instead of chasing college numbers forever.

    Why Is My Smart Scale Body Fat Reading Different Every Day?

    Smart scale body fat readings jump around because bioelectrical impedance depends heavily on water in the body. Dehydration, a salty meal, hard training, or menstrual cycle changes all affect conductivity and skew readings. To get steadier trends, I test under the same conditions, such as first thing in the morning after using the restroom. I then compare that trend with tape‑based results or the Tools Repository calculator for a calmer picture of progress.

    Tip: I focus on weekly or monthly averages from my smart scale instead of reacting to a single surprising number.

  • How to Calculate Compound Interest Step by Step

    How to Calculate Compound Interest Step by Step

    Table of Contents

    Introduction

    Trying to work out how to calculate compound interest can feel intimidating when money, grades, or client quotes depend on getting the numbers right.

    To calculate it step by step, start with the standard compound interest formula A = P(1 + r/n)^(nt), then plug in your principal, rate, compounding frequency, and time. For a simple example, $5,000 at 5 percent, compounded monthly for one year, becomes about $5,255.81, which means $255.81 in compound interest.

    This guide breaks that process into plain language, compares simple and compound interest, shows monthly and daily examples, and walks through how free tools like the Tools Repository Compound Interest Calculator can handle the heavy math for you.

    Key Takeaways

    Before we go deep, here are the big ideas you will use again and again.

    • The core compound interest formula A = P(1 + r/n)^(nt) drives every example in this guide. It links your starting balance, interest rate, time, and compounding frequency. Once you know those four values, you can compute future balances by hand or in code.

    • Time is the strongest factor in compound growth, even more than rate. The longer money stays invested, the more “interest on interest” you get. According to Investor.gov, a steady 5 percent return can roughly double money in about 15 years.

    • Compounding frequency matters because interest can be added yearly, monthly, or even daily. More frequent compounding means slightly more growth for the same rate. The difference looks small at first but becomes large over many years.

    • Banks often advertise APY, which already includes compounding effects, while the formula uses the plain annual rate. Mixing the two leads to inflated results. Always match the calculator setting with the kind of rate you enter.

    • Free tools like the Compound Interest Calculator on Tools Repository let you test many scenarios quickly. You can change rates, timelines, and contribution patterns in seconds. That saves time for developers, students, and freelancers who need fast, private calculations.

    What Is Compound Interest and How Does It Work?

    Two jars comparing simple and compound interest coin growth

    Compound interest is interest calculated on your original principal plus any interest that has already been added. Simple interest only uses the starting principal, so growth is straight and steady over time. With compounding, the base keeps growing, so the curve bends upward and speeds up.

    Here is a quick comparison using $5,000 at 5 percent for three years, with no extra deposits. Simple interest adds $250 each year, because 5 percent of $5,000 is $250. Compound interest keeps updating the base, so each year’s interest is slightly larger than the last one. This is the “snowball” people talk about.

    YearSimple Interest BalanceCompound Interest Balance
    1$5,250$5,250.00
    2$5,500$5,512.50
    3$5,750~$5,788.13

    “Compound interest is the eighth wonder of the world. He who understands it, earns it; he who doesn’t, pays it.” — often attributed to Albert Einstein

    By year three, compound interest already pulls ahead, even in this short example. Over ten or twenty years, that gap grows into thousands of dollars. According to Morningstar, long‑term stock market returns around 10 percent a year can turn modest starting amounts into large balances when gains are reinvested.

    For students, this same math explains why unpaid credit card balances can slide out of control. For freelancers and small business owners, it shows how money left in a high‑yield account grows without more effort. The key idea is simple: each period, you earn interest on a slightly bigger balance than before.

    The Compound Interest Formula Explained

    Financial planning desk with calculator and formula sketches

    The standard compound interest formula shows exactly how the balance grows over time. It is written as A = P(1 + r/n)^(nt). This single expression works for savings accounts, loans, and even investment models, as long as you have a rate and a compounding schedule.

    Here is what each letter represents.

    SymbolMeaning
    AFuture amount after interest is added
    PPrincipal, or starting amount of money
    rAnnual interest rate written as a decimal
    nNumber of compounding periods per year
    tTime in years that money stays invested or borrowed

    The term (1 + r/n) is the growth factor for one compounding period. You raise that factor to the power of nt to apply it many times. That exponent is what creates the curved, exponential growth you see on charts. A flat 5 percent simple interest line never bends upward this way.

    One common point of confusion is the difference between the nominal rate in the formula and APY. The nominal rate is the plain yearly rate before compounding, and it is what you should use as r. APY, or Annual Percentage Yield, already includes the effect of compounding. According to the FDIC, banks use APY in ads to show the true yearly return. If you enter APY into a calculator that also compounds monthly or daily, you count compounding twice and the result comes out too high.

    For developers building tools, this means your UI must be clear about which number the user should enter. Tools Repository follows the same formula and leaves control of rate and frequency in the user’s hands.

    How to Calculate Compound Interest Step by Step

    Woman calculating compound interest on computer with upward graph

    To calculate compound interest by hand, you follow the formula with a clear order of operations. First you identify P, r, n, and t. Then you compute the rate per period, apply the exponent, and multiply by the principal. This process also mirrors how you would write a function in JavaScript or Python.

    Let us start with the simple example mentioned earlier. Suppose you place $5,000 in a savings account at 5 percent annual interest, compounded monthly, for one year. There are no extra deposits. You want to know the balance after that year and how much of it is interest.

    1. Identify the variables and match them to the formula. P is $5,000 because that is your starting amount. r is 0.05, since 5 percent becomes 0.05. n is 12 because interest compounds monthly, and t is 1 because you are looking at a one‑year period.

    2. Write the formula with your numbers in place. That gives A = 5,000 × (1 + 0.05 ÷ 12)^(12 × 1). This step shows exactly what any calculator or script should compute. It also helps you catch mistakes in variables before you start punching keys or writing code.

    3. Divide the annual rate by the compounding frequency. Compute 0.05 ÷ 12 to get about 0.00416667, which is the rate per month. This smaller rate is what actually applies each period. In a program, this is often stored as a separate variable for clarity.

    4. Add 1 to the rate per period to form the growth factor. That gives 1.00416667. This number tells you how much the balance grows each month. If the balance were $1, it would become about $1.00417 after one compounding step.

    5. Calculate the exponent and apply it. The exponent nt is 12 × 1, so it equals 12. You then compute 1.00416667^12, which is about 1.05116. This means your money grows by about 5.116 percent over the year with monthly compounding.
    6. Multiply this factor by the principal. You take $5,000 × 1.05116 to get roughly $5,255.81. That balance includes both your original $5,000 and $255.81 in compound interest. According to Investor.gov, this type of calculation is standard for bank savings examples.

    Tip: When you use a calculator or spreadsheet, round only at the final step. Rounding earlier can create small differences from published examples.

    Now look at a longer daily compounding case to see the snowball more clearly. Place $10,000 in an account at 4 percent, compounded daily, with no extra deposits. Using the same formula with n set to 365 and t set to 1, the first year ends around $10,408.08, which means about $408.08 in interest.

    To make the pattern clearer, focus on a few checkpoints:

    • End of year 1: Balance ~$10,408.08; interest earned ~$408.08.

    • End of year 2: Interest is applied to the new $10,408.08 balance rather than the original $10,000, which leads to about $424.74 in interest for year two and a balance near $10,832.82.

    • End of year 10: The balance grows to about $14,917.92, so the total interest over the decade is $4,917.92.

    The pattern is clear: each year, interest grows because the base is larger, even though the rate stays at 4 percent.

    How Compounding Frequency and Regular Contributions Affect Your Returns

    Five glass cylinders showing increasing compounding frequency returns

    Compounding frequency describes how often interest is applied to your balance. The more often it happens, the more chances your money has to grow. For the same rate and time, daily compounding will always produce a slightly higher ending balance than monthly or yearly compounding.

    Here is a comparison using $10,000 at 5 percent for ten years with no extra deposits.

    Frequencyn ValueApproximate Final Balance
    Annual1$16,288.95
    Semiannual2$16,386.16
    Quarterly4$16,436.19
    Monthly12$16,470.09
    Daily365$16,486.65

    At this scale, the jump from monthly to daily looks small. However, on larger balances or longer periods, that gap expands. According to NerdWallet, even a one‑percentage‑point difference in effective rate can add tens of thousands of dollars to long‑term savings. For anyone building financial apps, this is why a compounding frequency dropdown is not just a detail; it changes real outcomes.

    Regular contributions matter even more than compounding frequency. Return to the $10,000 at 4 percent, compounded daily, over ten years. With no extra deposits, it grows to $14,917.92. If you add $100 at the end of every month, the final balance jumps to about $29,647.91. Now you have put in $22,000 of your own money and earned $7,647.91 in interest.

    This jump happens because every $100 deposit starts earning interest right away. In math terms, you combine the standard formula with the future value of a series of payments.

    For quick planning, remember:

    • Frequency helps, especially over long periods.

    • Regular deposits help even more, because each contribution has years to grow.

    • Tools like the Tools Repository Compound Interest Calculator make it easy to test how small monthly changes affect long‑term totals.

    For students and developers, this is the same idea behind retirement or savings‑goal planners. For freelancers, it shows how turning spare cash into regular transfers can change long‑term results.

    How to Use Tools Repository’s Free Compound Interest Calculator

    Hands using online compound interest calculator on laptop

    Tools Repository offers a free Compound Interest Calculator that runs in the browser and needs no sign‑up. You enter your principal, annual rate, compounding frequency, and time, then it returns the future balance and total interest. Everything happens on your device, so your numbers are not sent to a server.

    To try a scenario:

    1. Enter your starting balance, interest rate, and number of years.

    2. Choose how often interest compounds.

    3. Decide whether you plan to add regular deposits and, if so, how much.

    The tool instantly updates the results as you tweak values. This is handy when you want to see how adding five more years or raising the rate by one point shifts the outcome.

    You can also test scenarios that match your code or homework. For example, calculate $5,000 at 5 percent monthly in the Tools Repository calculator, then repeat the steps by hand to confirm your function or spreadsheet. According to FINRA, many adults struggle with basic compound interest questions, so using a trusted calculator as a reference can help catch small math slips.

    “An investment in knowledge pays the best interest.” — Benjamin Franklin

    Tools Repository also provides a Savings Goal Calculator that works well with the compound interest tool. You can start from a target number and see how much you need to save each month to get there. All of these calculators are free, open, and fast, with no tracking or subscription walls, which suits developers, students, and small teams who care about privacy.

    Start Putting Compound Interest to Work for You

    Compound interest rewards three habits:

    • Start early.

    • Let money sit for longer periods.

    • Add steady contributions whenever you can.

    The formula A = P(1 + r/n)^(nt) is the simple math behind those ideas.

    Remember to keep APY and nominal rate straight so your calculations stay honest. Then plug your own numbers into Tools Repository’s Compound Interest Calculator and Savings Goal Calculator. With a few quick tests, you can design savings and investment plans that match your real‑life cash flow.

    “My wealth has come from a combination of living in America, some lucky genes, and compound interest.” — Warren Buffett

    Frequently Asked Questions

    What Is the Difference Between Simple and Compound Interest?

    Simple interest is calculated only on the original principal, so the added amount stays the same every period. Compound interest uses the principal plus all past interest, so the added amount keeps growing.

    For example, $1,000 at 5 percent simple interest earns $50 each year, while compound interest earns a bit more each year. That extra growth matters a lot over long timelines.

    How Do I Calculate Compound Interest Monthly?

    To calculate monthly compounding, set n = 12 in the formula A = P(1 + r/n)^(nt).

    For example, with $2,000 at 6 percent for three years, use r = 0.06, n = 12, t = 3. You compute:

    A = 2,000 × (1 + 0.06 ÷ 12)^(12 × 3)

    A calculator or spreadsheet will give the final amount and let you see how much of it is interest. Tools Repository’s Compound Interest Calculator can run the same numbers so you can double‑check your work.

    What Is APY and How Is It Different from the Interest Rate?

    The nominal interest rate is the base yearly rate before compounding and is what you use as r in the formula. APY, or Annual Percentage Yield, already includes the effect of compounding over a year.

    The APY formula is:

    APY = (1 + r/n)^n − 1

    If you type APY into a compound interest calculator that also compounds monthly or daily, you will count compounding twice and get an inflated result.

    How Does Daily Compound Interest Work?

    Daily compound interest sets n = 365 in the formula, so interest is added every day. Each day’s balance is slightly higher than the day before, which means the next interest amount is also slightly higher. Over a year, daily compounding on a savings account will beat monthly compounding at the same nominal rate. Many high‑yield savings and money market accounts in the US use this daily method.

    What Is the Rule of 72 and How Does It Relate to Compound Interest?

    The Rule of 72 is a quick mental shortcut to estimate how long money takes to double. You divide 72 by the annual rate to get the rough number of years. For example, at 6 percent, 72 ÷ 6 gives about 12 years.

    It is only an approximation, but it helps compare savings accounts or investment choices without running a full compound interest calculation.